• Chinese Optics Letters
  • Vol. 18, Issue 12, 122201 (2020)
A. Garza-Rivera1, J. E. Gómez-Correa2、*, F. J. Renero-Carrillo1, J. P. Trevino3, and V. Coello4
Author Affiliations
  • 1INAOE, Departamento de Óptica, Tonantzintla, Puebla, 72840, Mexico
  • 2Catedras Conacyt – CICESE, Unidad Monterrey, PIIT Apodaca, Nuevo León, 66629, Mexico
  • 3Tecnológico de Monterrey, Campus Puebla, Departamento de Bioingeniería y Ciencias, Puebla, Puebla, 72453, Mexico
  • 4CICESE, Unidad Monterrey, PIIT Apodaca, Nuevo León, 66629, Mexico
  • show less
    DOI: 10.3788/COL202018.122201 Cite this Article Set citation alerts
    A. Garza-Rivera, J. E. Gómez-Correa, F. J. Renero-Carrillo, J. P. Trevino, V. Coello. Gabor superlens with variable focus[J]. Chinese Optics Letters, 2020, 18(12): 122201 Copy Citation Text show less
    Microlens array of a Gabor superlens.
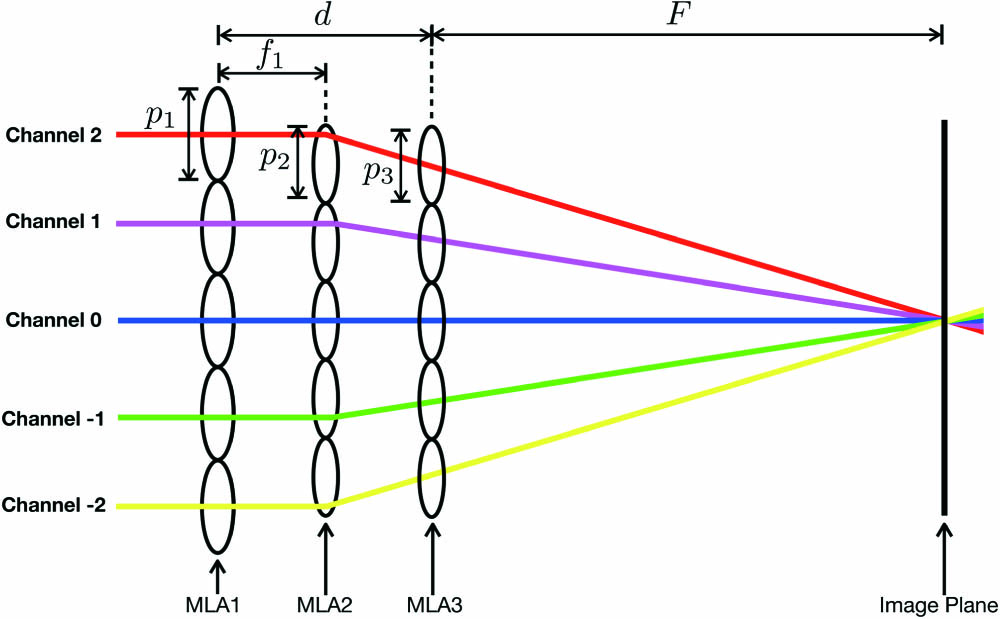
    Fig. 1. Microlens array of a Gabor superlens.
    Parameters of a liquid tunable lens that works by electrowetting.
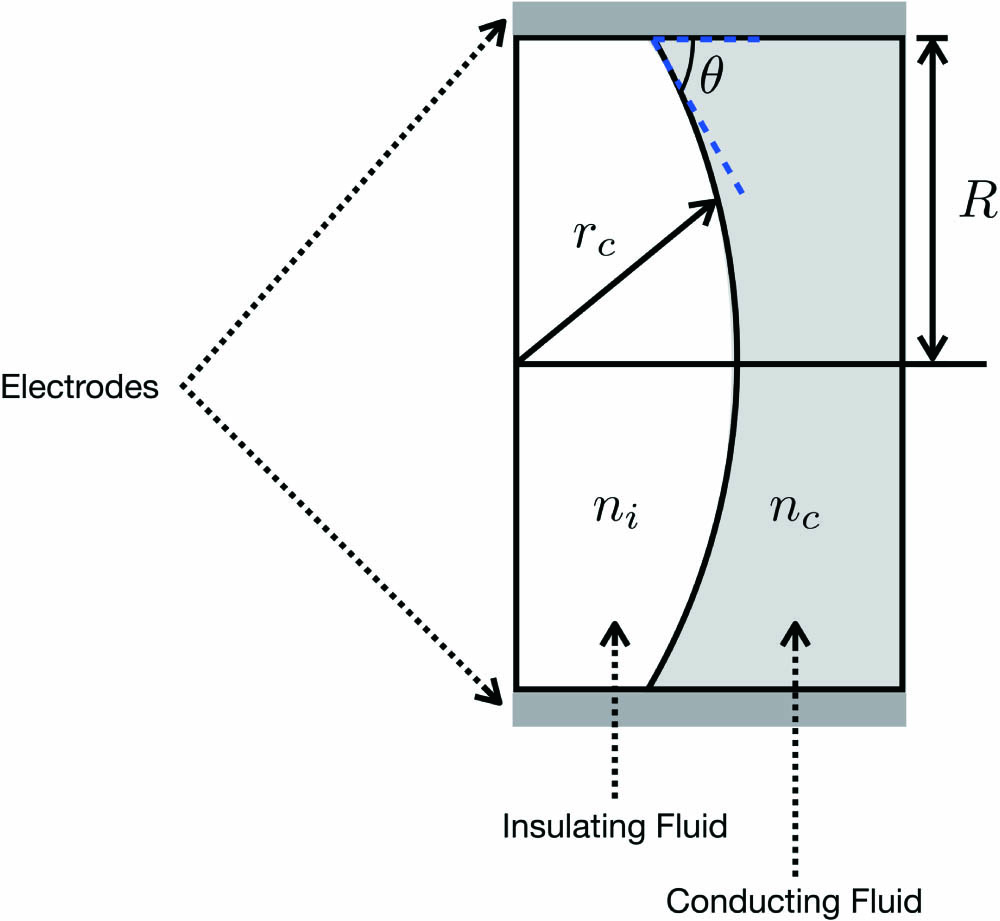
    Fig. 2. Parameters of a liquid tunable lens that works by electrowetting.
    Micro-tunable lenses are placed in the third array (MLA3).
    Fig. 3. Micro-tunable lenses are placed in the third array (MLA3).
    Variation of the second radius of curvature produced by a voltage range between 0 V and 115 V.
    Fig. 4. Variation of the second radius of curvature produced by a voltage range between 0 V and 115 V.
    Simulation of GSL with an array of micro-tunable liquid lens with V=115 V and a radius of curvature of −0.061 in the middle surface of the third array.
    Fig. 5. Simulation of GSL with an array of micro-tunable liquid lens with V=115V and a radius of curvature of −0.061 in the middle surface of the third array.
    Spot registered by the detector in the simulation of the GSL with an array of micro-tunable liquid lenses as MLA3 applying a voltage (V) and a radius of curvature (rc) in the middle surface of the third array: (a) V=0 V and rc=∞, (b) V=100 V and rc=−0.204, (c) V=105 V and rc=−0.117, (d) V=110 V and rc=−0.081, and (e) V=115 V and rc=−0.061.
    Fig. 6. Spot registered by the detector in the simulation of the GSL with an array of micro-tunable liquid lenses as MLA3 applying a voltage (V) and a radius of curvature (rc) in the middle surface of the third array: (a) V=0V and rc=, (b) V=100V and rc=0.204, (c) V=105V and rc=0.117, (d) V=110V and rc=0.081, and (e) V=115V and rc=0.061.
    Total Seidel aberration coefficients plotted for increasing values of the focal distance. Observe that the central channel with all aberrations is close to zero except for the spherical aberration, as shown in (a). Other channels show an increase of all aberration coefficients except for field curvature, as shown in (b) and (c).
    Fig. 7. Total Seidel aberration coefficients plotted for increasing values of the focal distance. Observe that the central channel with all aberrations is close to zero except for the spherical aberration, as shown in (a). Other channels show an increase of all aberration coefficients except for field curvature, as shown in (b) and (c).
    Zoom of the ray tracing at the detector (image plane) of the GSL system with (a) V=100 V and rc=−0.204, and (b) V=115 V and rc=−0.061. An apparent trade-off between transverse and longitudinal ray aberrations is observed as a zoom is performed close to the focal plane. This explains the behavior of the focal spot size as the focal distance varies.
    Fig. 8. Zoom of the ray tracing at the detector (image plane) of the GSL system with (a) V=100V and rc=0.204, and (b) V=115V and rc=0.061. An apparent trade-off between transverse and longitudinal ray aberrations is observed as a zoom is performed close to the focal plane. This explains the behavior of the focal spot size as the focal distance varies.
    Corresponding LensSurface #Radius of Curvature Rc (μm)Thickness t(μm)Refractive Index (ni)Pitch (μm)
    Object1
    MLA12162301.563840100
    3−6501901.000000
    MLA24165201.78472084
    5−1641691.000000
    MLA36101.52944066
    7rc101.337774
    8−1004221.000000
    Image Plane9F
    Table 1. Optical Parameters of the GSL System When the Second Radius of Curvature of the Liquid Micro-Tunable Lens Is rc and Gabor Focal Length Is Fa
    Voltage (V)Peak Incoherent Irradiance [(W/cm)2]
    01.050×10⁷
    1001.600×107
    1053.000×107
    1106.650×107
    1152.855×108
    Table 2. Peak Incoherent Irradiance Distribution for Each Voltage
    Voltage (V)Radius of Curvature rc (mm)Focal Length of the Doublets f (mm)Gabor Focal Length F (mm)
    100−0.2040.23240.86
    105−0.1170.20250.87
    110−0.0810.17600.88
    115−0.0610.15430.89
    Table 3. Radius of Curvature (rc), Focal Length of the Doublets f, and Gabor Focal Length (F) of the GSL System as Functions of the Change of Voltage from 100 V to 115 V
    A. Garza-Rivera, J. E. Gómez-Correa, F. J. Renero-Carrillo, J. P. Trevino, V. Coello. Gabor superlens with variable focus[J]. Chinese Optics Letters, 2020, 18(12): 122201
    Download Citation