• Spectroscopy and Spectral Analysis
  • Vol. 41, Issue 9, 2823 (2021)
Yu-xuan ZHU1、*, Jing-bin LU1、1;, Xiao-fan ZHAO2、2;, Xiao-yan LIU4、4;, Wei-wei CUI2、2;, Wei LI2、2;, Yu-sa WANG2、2;, Zhong-hua LÜ2、2; 3;, and Yong CHEN2、2; *;
Author Affiliations
  • 11. College of Physics, Jilin University, Changchun 130012, China
  • 22. Institute of High Energy Physics, Chinese Academy of Sciences, Beijing 100049, China
  • 44. College of Physical Science and Technology, Heilongjiang University, Harbin 150080, China
  • show less
    DOI: 10.3964/j.issn.1000-0593(2021)09-2823-06 Cite this Article
    Yu-xuan ZHU, Jing-bin LU, Xiao-fan ZHAO, Xiao-yan LIU, Wei-wei CUI, Wei LI, Yu-sa WANG, Zhong-hua LÜ, Yong CHEN. An Application of Lucy Richardson Iterative in X-Ray Fluorescence Analysis[J]. Spectroscopy and Spectral Analysis, 2021, 41(9): 2823 Copy Citation Text show less
    A detector package of CCD236Each detectoris divided into four quadrants
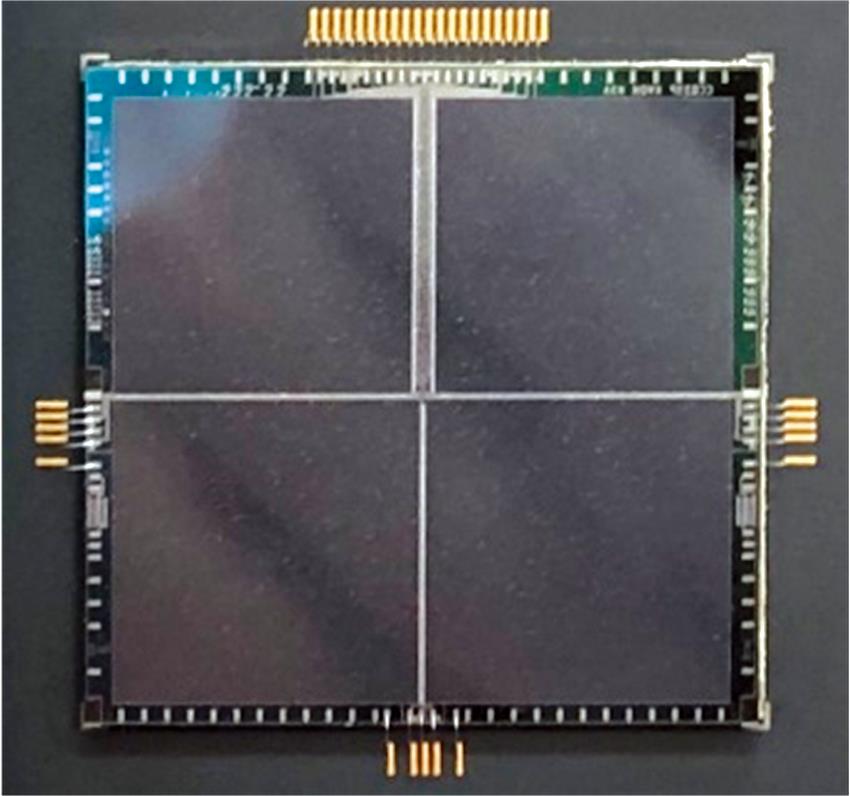
    Fig. 1. A detector package of CCD236
    Each detectoris divided into four quadrants
    The RSP of CCD236 detector
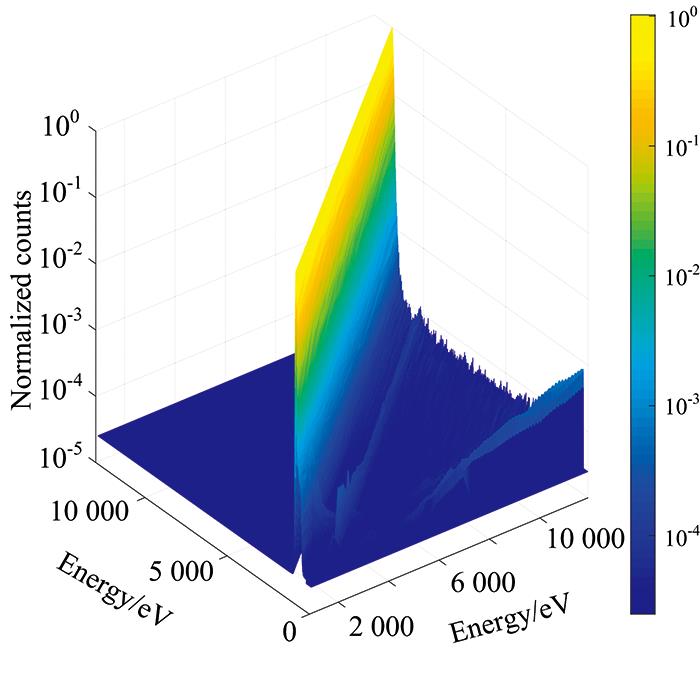
    Fig. 2. The RSP of CCD236 detector
    Schematic diagram and picture of some device of spectrum measurement
    Fig. 3. Schematic diagram and picture of some device of spectrum measurement
    Spectrum of background
    Fig. 4. Spectrum of background
    Spectrum measurement of 55Fe X-ray source and iteration resultsThe blue dotted line and red star dotted line are the iteration results without and with the background, respectively
    Fig. 5. Spectrum measurement of 55Fe X-ray source and iteration results
    The blue dotted line and red star dotted line are the iteration results without and with the background, respectively
    Curve of convergence factor ε with iteration times
    Fig. 6. Curve of convergence factor ε with iteration times
    Curve of FWHM with iteration times
    Fig. 7. Curve of FWHM with iteration times
    Results of 55Fe spectrum iterative inverse
    Fig. 8. Results of 55Fe spectrum iterative inverse
    Experimental and convolution spectrum. The spectra are normalized by area
    Fig. 9. Experimental and convolution spectrum. The spectra are normalized by area
    Spectrum measurement of material by CCD236 detector; The spectrum is normalized by area
    Fig. 10. Spectrum measurement of material by CCD236 detector; The spectrum is normalized by area
    元素名称能量/keV半高全宽/eV荧光线相对强度
    AgLα=2.98446.21.000
    AgLβ1=3.15153.70.502
    AgLβ2=3.34861.90.105
    AgLγ1=3.52062.90.029
    AgLγ2=3.74380.10.004
    AgLI=2.63483.80.061
    CrKα=5.41594.90.014
    MnKα=5.89959.20.521
    MnKβ=6.49092.40.069
    NiKα=7.47875.30.104
    CuKα=8.04876.10.295
    CuKβ=8.90550.00.016
    ErLα=6.94984.40.010
    Table 1. Analysis results of element composition
    元素名称能量/keV荧光产额拟合值荧光产额理论值
    AgLα=2.9841.001.00
    AgLβ1=3.1510.510.55
    AgLβ2=3.3480.110.12
    Table 2. Analysis results of Ag fluorescence yield
    Yu-xuan ZHU, Jing-bin LU, Xiao-fan ZHAO, Xiao-yan LIU, Wei-wei CUI, Wei LI, Yu-sa WANG, Zhong-hua LÜ, Yong CHEN. An Application of Lucy Richardson Iterative in X-Ray Fluorescence Analysis[J]. Spectroscopy and Spectral Analysis, 2021, 41(9): 2823
    Download Citation