
Zhen Dong, Lin Sun, Xirong Liu, Yongji Wang, Tianchen Liang. CDAG-Improved Algorithm and Its Application to GF-6 WFV Data Cloud Detection[J]. Acta Optica Sinica, 2020, 40(16): 1628001
- Acta Optica Sinica
- Vol. 40, Issue 16, 1628001 (2020)
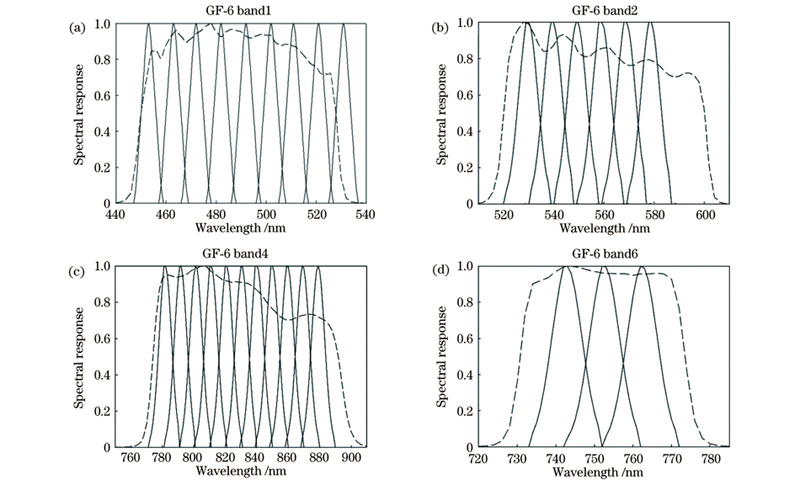
Fig. 1. Comparison of AVIRIS(solid line) and GF-6 WFV(dashed line) data spectral response curves at different bands. (a) 1st band; (b) 2nd band; (c) 4th band; (d) 6th band
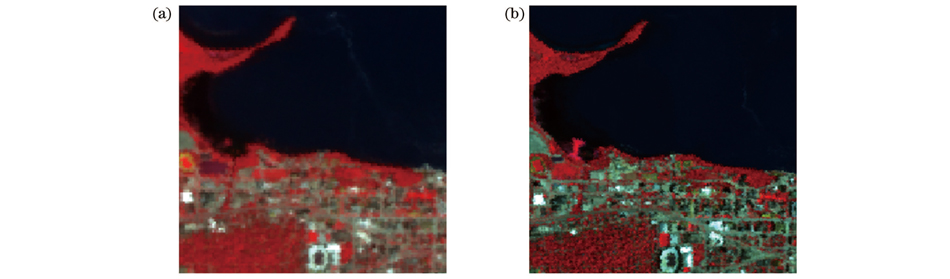
Fig. 2. Comparison of raw image and simulated image of the Wisconsin area, USA. (a) Raw GF-6 WFV image; (b) simulated GF-6 WFV image
Fig. 3. Flow chart of GF-6 WFV data cloud detection algorithm
Fig. 4. Cloud detection results of GF-6 WFV data under different cloud cover conditions. (a) 2018-09-02; (b) 2019-06-07; (c) 2019-04-21; (d) 2018-11-03; (e) 2018-12-01; (f) 2018-09-23
Fig. 5. Cloud detection results of GF-6 WFV data before and after bright surface removal. (a) 2018-12-30; (b) 2019-04-21; (c) 2019-05-04
Fig. 6. Partial image vectorization results. (a) Vectorization result of vegetation image; (b) vectorization result of urban area image
Table 1. Typical examples of bright surface pixels in the pixel dataset
|
Table 2. Band combination and threshold selected under the original CDAG method
|
Table 3. Band and threshold selected by three-band dispersion combination
|
Table 4. Band and threshold selected by the bright surface detection algorithm
|
Table 5. Accuracy evaluation of cloud pixel detection results

Set citation alerts for the article
Please enter your email address
© Copyright 2018-2021 | Chinese Laser Press. All Rights Reserved 沪ICP备15018463号-20