• Laser & Optoelectronics Progress
  • Vol. 57, Issue 22, 221003 (2020)
Yongjia Huang1, Zaifeng Shi1、2、*, Zhongqi Wang1, and Zhe Wang1
Author Affiliations
  • 1School of Microelectronics, Tianjin University, Tianjin 300072, China
  • 2Tianjin Key Laboratory of Microelectronic Technology for Imaging and Sensing, Tianjin 300072, China
  • show less
    DOI: 10.3788/LOP57.221003 Cite this Article Set citation alerts
    Yongjia Huang, Zaifeng Shi, Zhongqi Wang, Zhe Wang. Improved U-Net Based on Mixed Loss Function for Liver Medical Image Segmentation[J]. Laser & Optoelectronics Progress, 2020, 57(22): 221003 Copy Citation Text show less
    Structure of proposed network
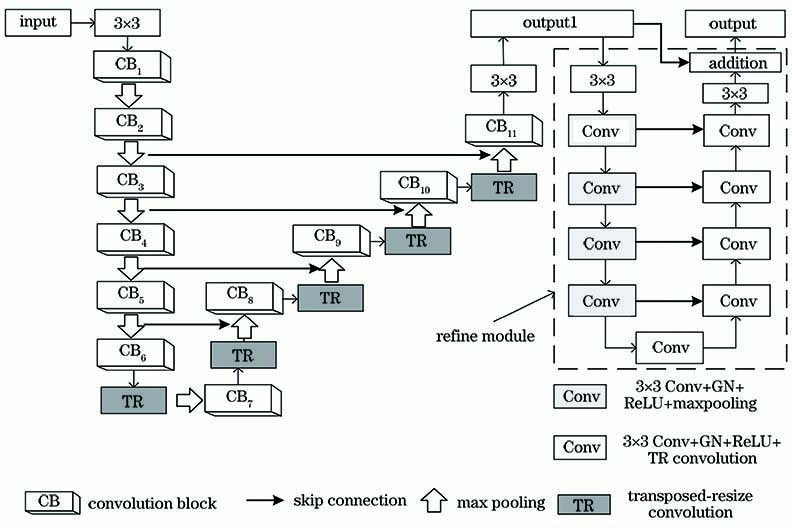
    Fig. 1. Structure of proposed network
    Improved U-Net structure
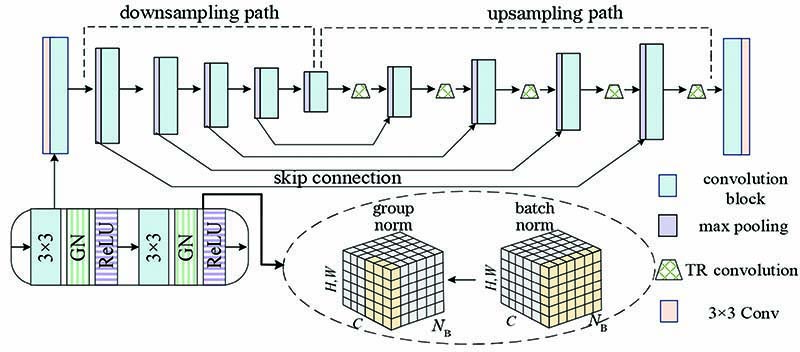
    Fig. 2. Improved U-Net structure
    Residual refine module of network structure. (a) General residual refine module; (b) improved residual refine module
    Fig. 3. Residual refine module of network structure. (a) General residual refine module; (b) improved residual refine module
    Training error and test accuracy of improved U-Net. (a) Liver tumor segmentation; (b) liver segmentation
    Fig. 4. Training error and test accuracy of improved U-Net. (a) Liver tumor segmentation; (b) liver segmentation
    Segmentation results of liver images obtained by different networks
    Fig. 5. Segmentation results of liver images obtained by different networks
    Box plot of Dice coefficient of liver segmentation
    Fig. 6. Box plot of Dice coefficient of liver segmentation
    Segmentation results of liver tumor images obtained by different networks
    Fig. 7. Segmentation results of liver tumor images obtained by different networks
    Box plot of Dice coefficient of liver tumor segmentation
    Fig. 8. Box plot of Dice coefficient of liver tumor segmentation
    Segmentation results of big nodules
    Fig. 9. Segmentation results of big nodules
    Segmentation results of small nodules
    Fig. 10. Segmentation results of small nodules
    NetworkDice coefficientVOE /%RVD /%SENJaccard coefficient
    FCN-8s88.3819.62-1.2586.490.88
    UNet82.7824.79-2.7281.460.83
    H-DenseUNet[5]96.507.401.80
    2D FCN[14]94.3010.70-1.40
    BS UNet[15]96.107.502
    Proposed network96.267.900.8095.960.92
    Table 1. Performance comparison of different networks for liver image segmentation
    NetworkDice coefficientVOE /%RVD /%SENJaccard coefficient
    FCN-8s75 .5771.43-14.2570.290.52
    U-Net72.2367.62-18.7266.870.40
    KC-SVM[16]8428.220.73
    RA-UNet[17]8330.610.74
    Edge-SVM[18]8236.700.69
    Proposed network83.3211.62-15.9879.880.72
    Table 2. Performance comparison of different networks for liver tumor image segmentation
    NetworkDice coefficientSENJaccard coefficient
    FCN-8s73.3279.830.64
    U-Net71.1776.960.71
    CDP-ResNet+IWS[19]81.8587.30
    DB-ResNet[20]82.7489.35
    CF-CNN+Scale[21]78.5586.01
    Proposed network79.2386.490.78
    Table 3. Performance comparison of different networks
    Yongjia Huang, Zaifeng Shi, Zhongqi Wang, Zhe Wang. Improved U-Net Based on Mixed Loss Function for Liver Medical Image Segmentation[J]. Laser & Optoelectronics Progress, 2020, 57(22): 221003
    Download Citation