
Fang Wang, Tian Kou, Renke Kou, Haiyan Wang. Detection Probability Envelope of Airborne IRST System after Variable Threshold Noise Ratio Optimization[J]. Acta Optica Sinica, 2019, 39(3): 0304002
- Acta Optica Sinica
- Vol. 39, Issue 3, 0304002 (2019)
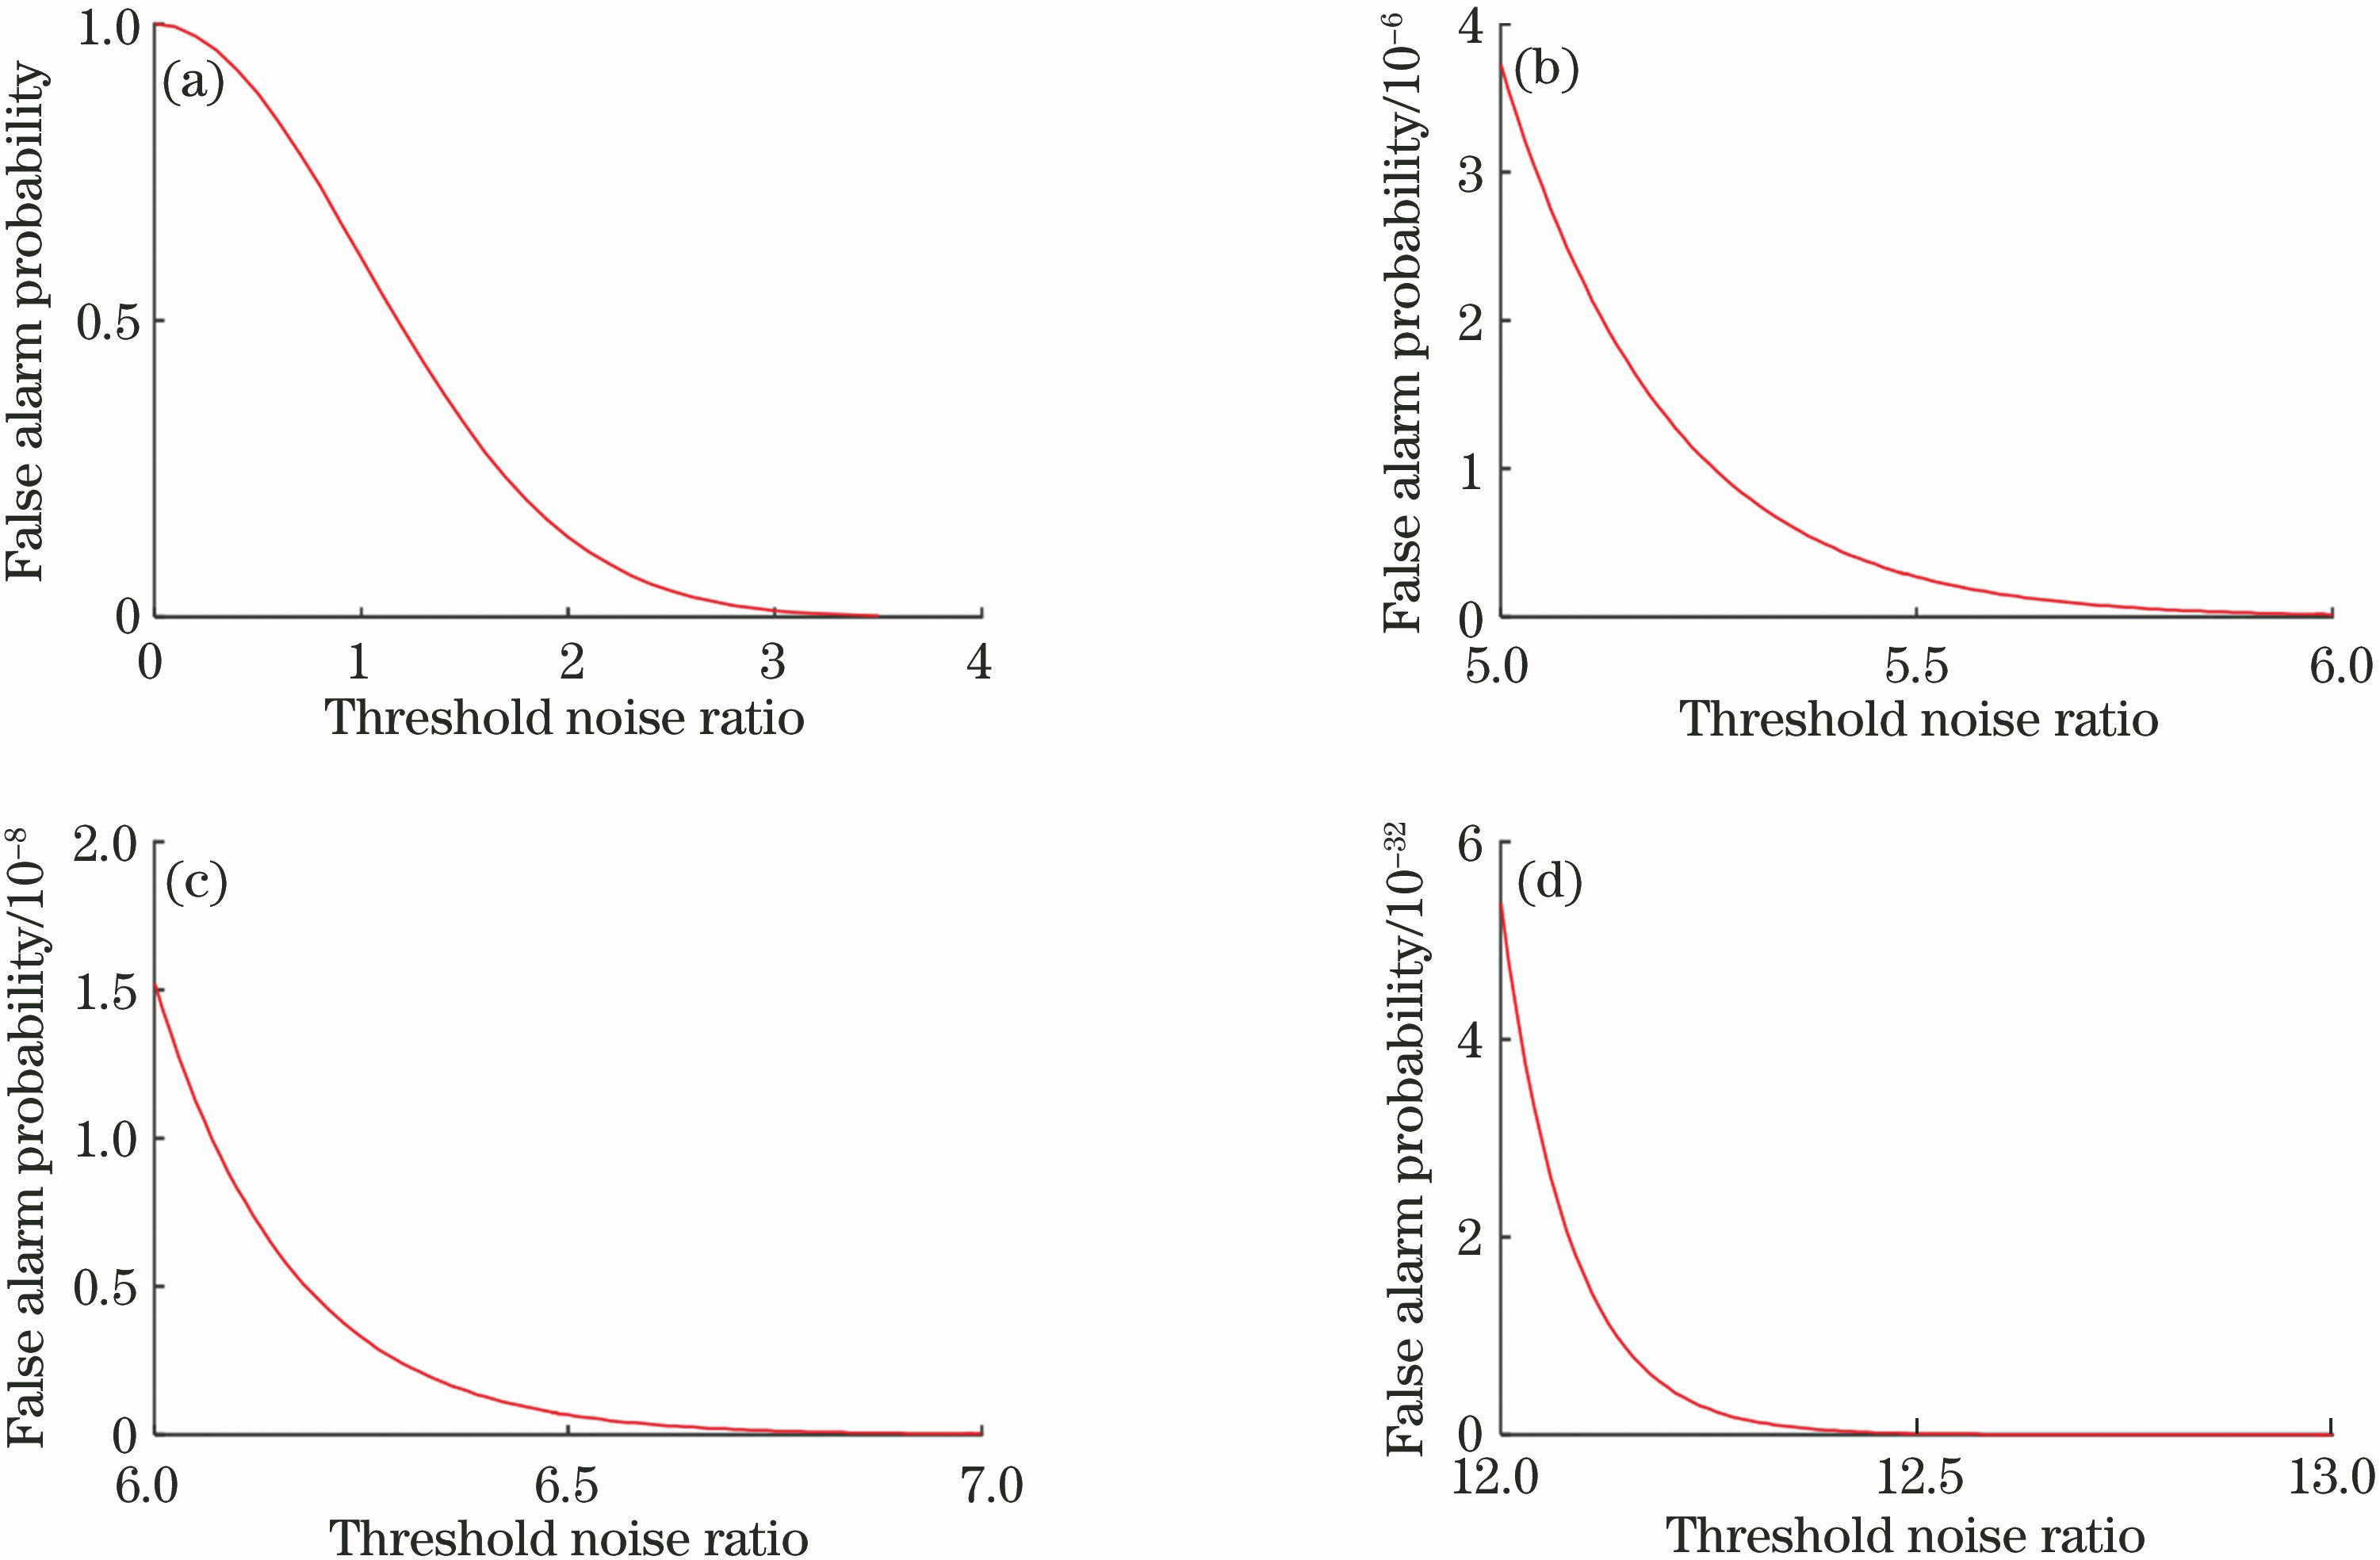
Fig. 1. Distribution of false alarm probability with different threshold noise ratio. (a) 0-4; (b) 5-6; (7) 6-7; (d) 12-13
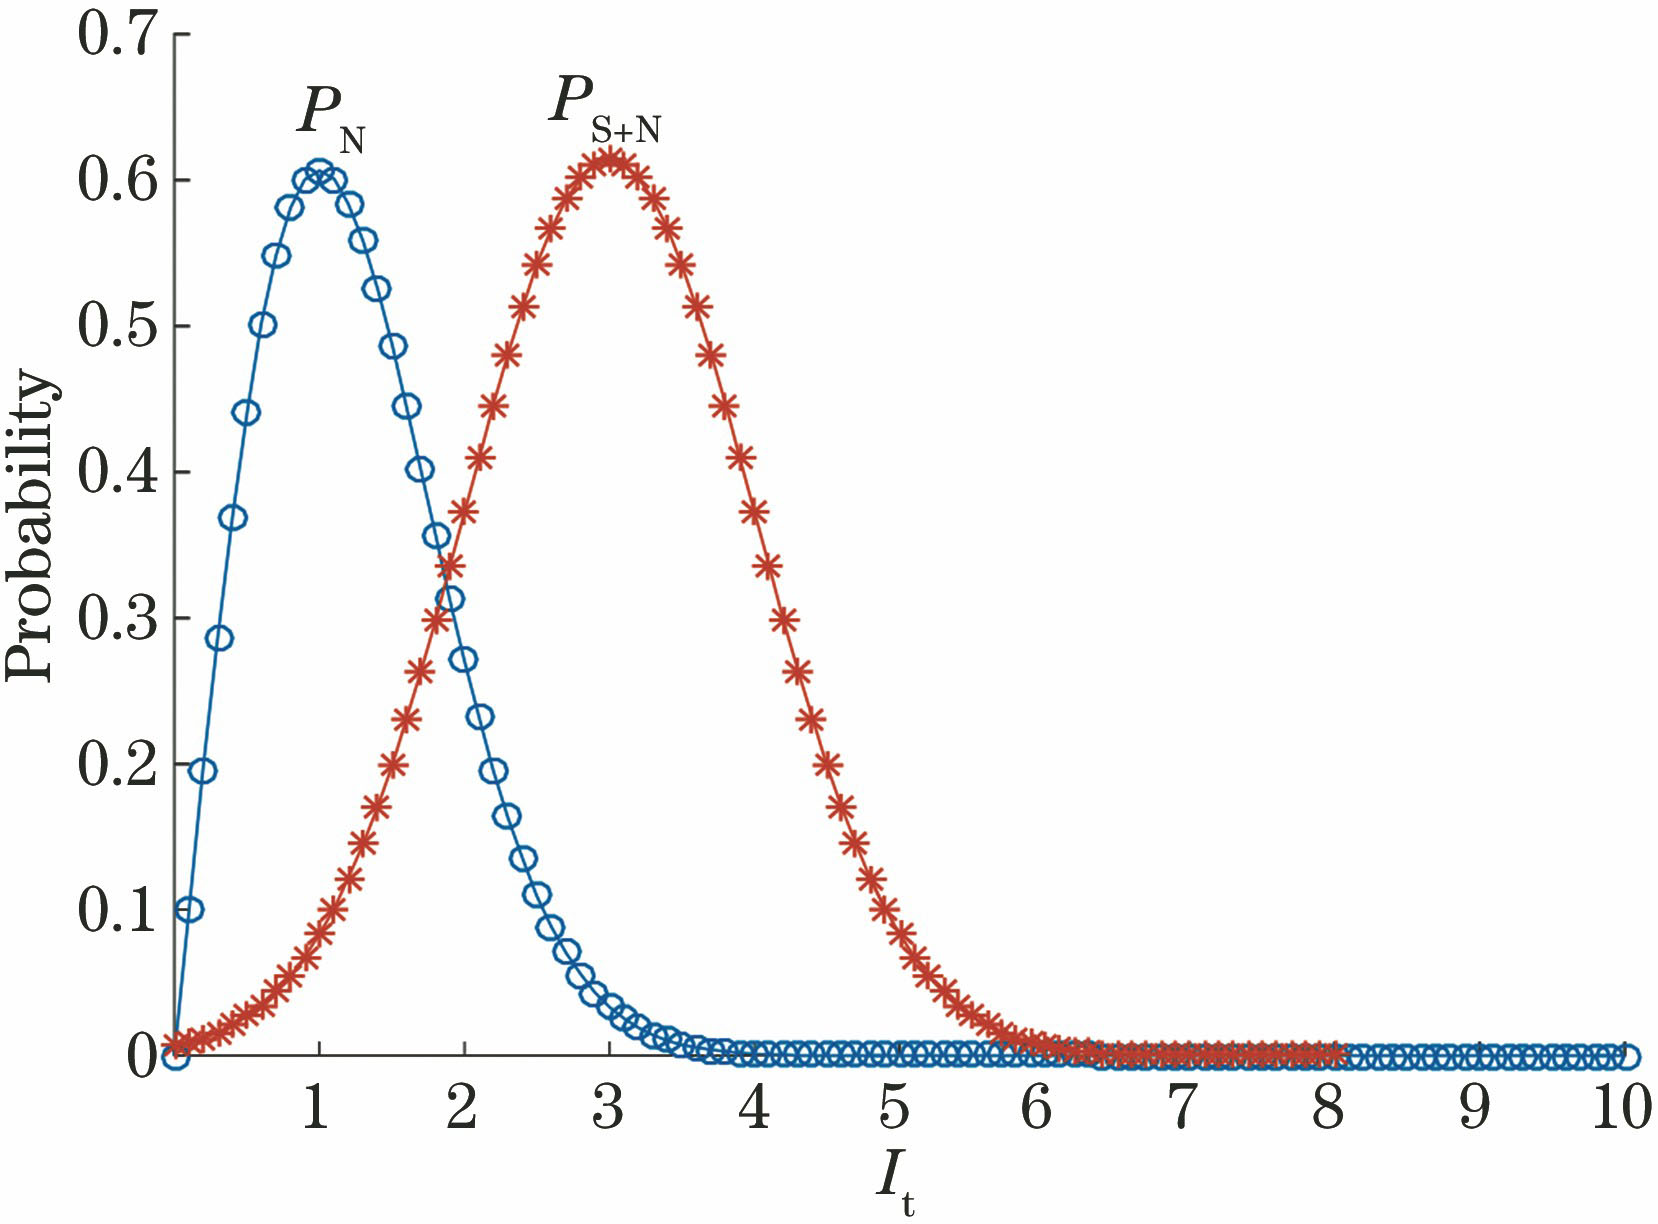
Fig. 2. Distributions of noise probability and signal plus noise probability
Fig. 3. Detection probability versus detection range
Fig. 4. Detection probability versus target speed
Fig. 5. Detection probability versus atmospheric transmissivity
Fig. 6. Flow chart of range solution of threshold noise ratio based on detection distance
Fig. 7. Threshold noise ratio versus detection range
Fig. 8. Threshold noise ratio versus target speed
Fig. 9. Threshold noise ratio versus atmospheric transmissivity
Fig. 10. Detection distance envelope
Fig. 11. Detection probability envelope
Fig. 12. Detection probability envelope under variable or constant threshold noise ratio
|
Table 1. Parameters of IRST system
|
Table 2. Values of threshold noise ratio at different detection ranges
|
Table 3. Values of threshold noise ratio under different object speeds
|
Table 4. Values of threshold noise ratio with different atmospheric transmissivity

Set citation alerts for the article
Please enter your email address
© Copyright 2018-2021 | Chinese Laser Press. All Rights Reserved 沪ICP备15018463号-20