
Jintao Li, Xiaojun Cheng, Zexin Yang, Rongqi Yang. Curvature-Grading-Based Compression for Point Cloud Data[J]. Laser & Optoelectronics Progress, 2019, 56(14): 142801
- Laser & Optoelectronics Progress
- Vol. 56, Issue 14, 142801 (2019)
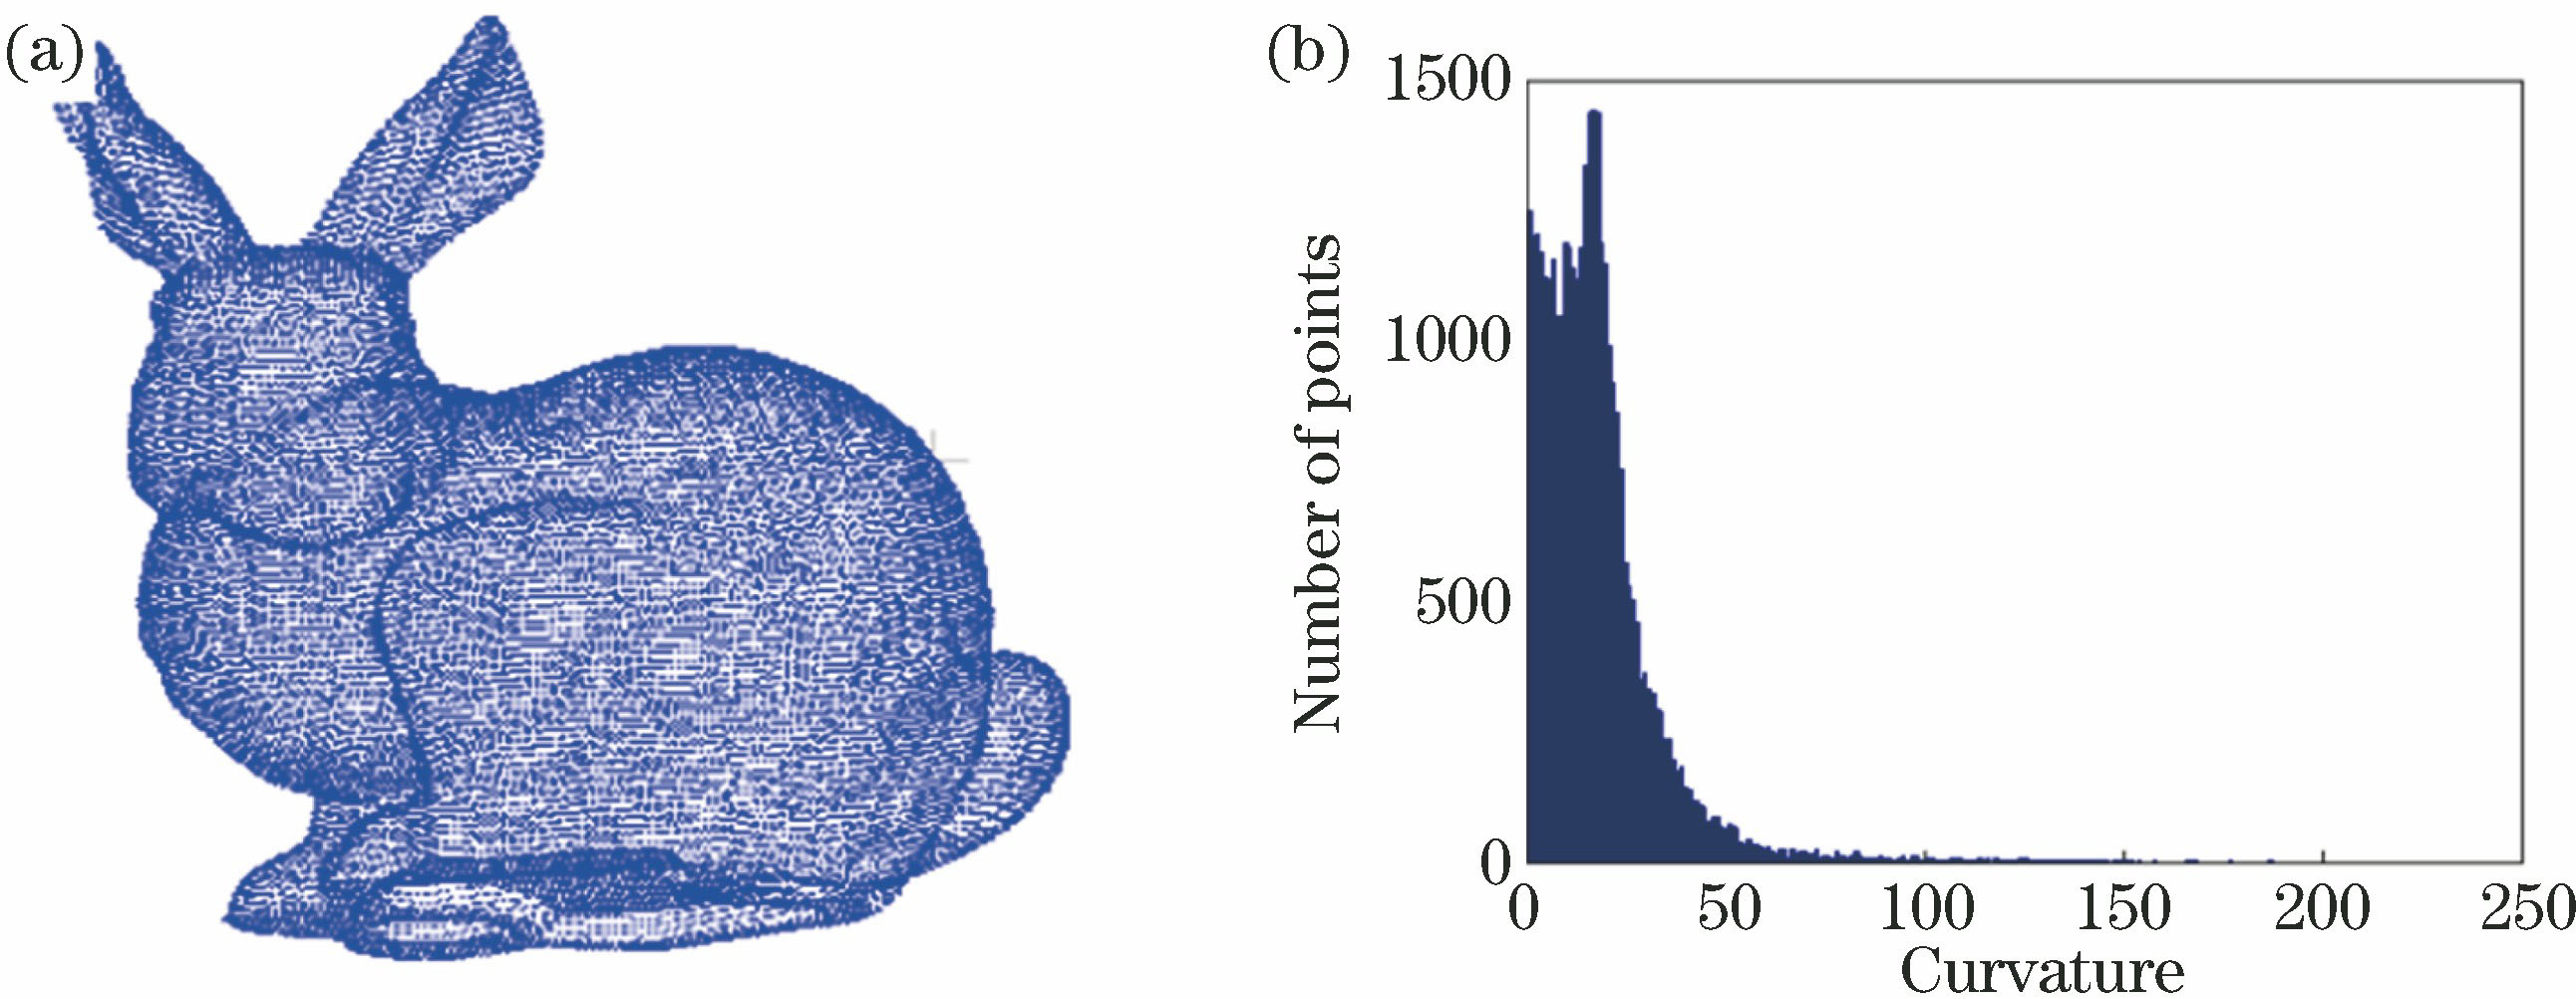
Fig. 1. Point cloud 1 and point number-curvature distribution. (a) Point cloud 1; (b) point number-curvature distribution
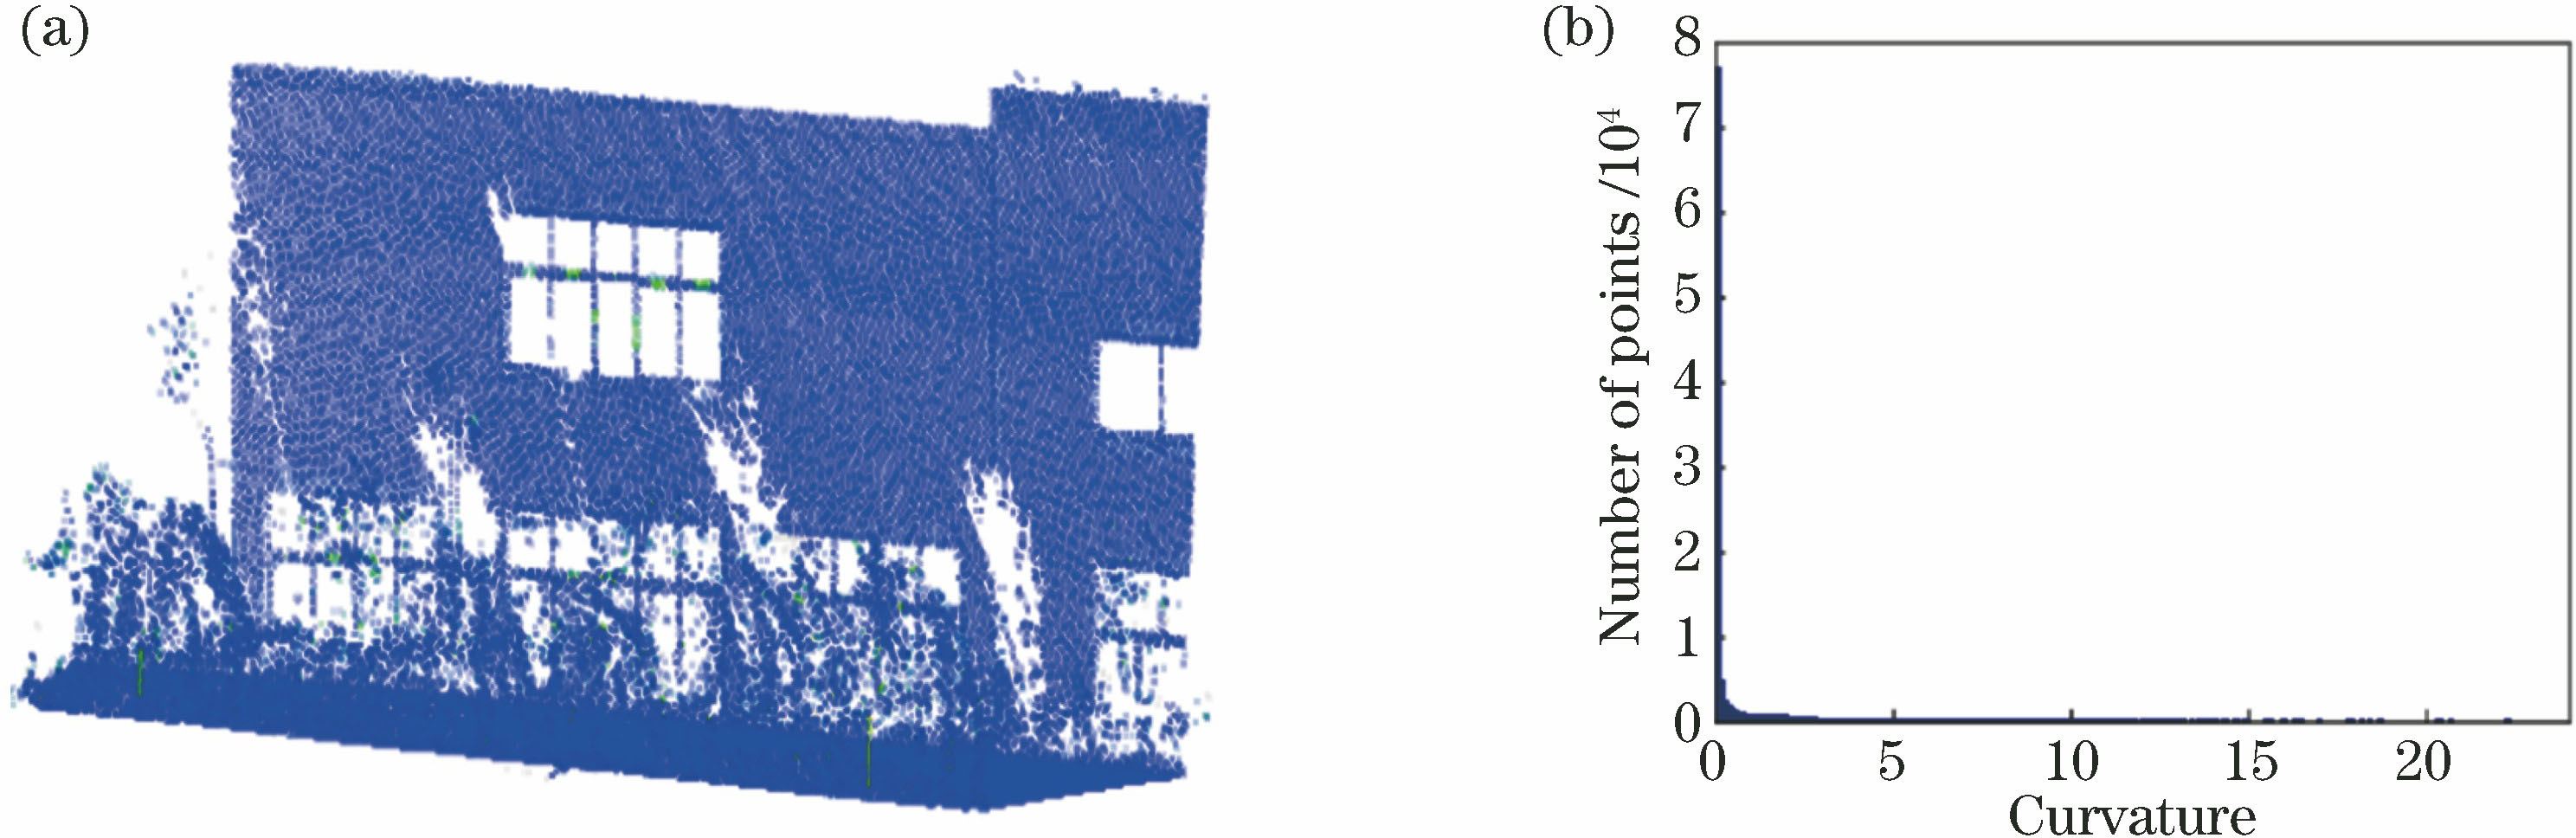
Fig. 2. Point cloud 2 and point number-curvature distribution. (a) Point cloud 2; (b) point number-curvature distribution
Fig. 3. Point cloud compression method based on curvature grading
Fig. 4. Diagram of curvature grading based on logarithmic function
Fig. 5. Effect of compression control factor on curvature level
Fig. 6. Cloud data before compression and the results of three compression methods. (a) Original data; (b) compression result using Geomagic software; (c) compression result using the method in Ref. [8]; (d) compression result using the method proposed in this paper
Fig. 7. A local area and compression results under different compression ratios. (a) Original data of a local area; (b) compression ratio 70%, S=53.0; (c) compression ratio 80%, S=10.5; (d) compression ratio 90%, S=1.1
Fig. 8. Surface model built before compression and after compression by three methods. (a) Model built from original data; (b) model built from result compressed by Geomagic software; (c) model built from result compressed by the method in Ref. [8]; (d) model built from result compressed by the method proposed in this paper
|
Table 1. Compression results of different thresholds
|
Table 2. Comparison of area changes of different compression methods

Set citation alerts for the article
Please enter your email address
© Copyright 2018-2021 | Chinese Laser Press. All Rights Reserved 沪ICP备15018463号-20