• Photonics Research
  • Vol. 6, Issue 9, 908 (2018)
Nianqiang Li1、*, H. Susanto2, B. R. Cemlyn1, I. D. Henning1, and M. J. Adams1
Author Affiliations
  • 1School of Computer Science and Electronic Engineering, University of Essex, Wivenhoe Park, Colchester CO4 3SQ, UK
  • 2Department of Mathematical Sciences, University of Essex, Wivenhoe Park, Colchester CO4 3SQ, UK
  • show less
    DOI: 10.1364/PRJ.6.000908 Cite this Article Set citation alerts
    Nianqiang Li, H. Susanto, B. R. Cemlyn, I. D. Henning, M. J. Adams. Modulation properties of solitary and optically injected phased-array semiconductor lasers[J]. Photonics Research, 2018, 6(9): 908 Copy Citation Text show less
    (a) Schematic of a phased array consisting of two laser waveguides, A and B, with each of width 2a and an edge-to-edge separation of 2d. (b) More details about the distribution of refractive indices n1,2, where g represents gain per unit length and α the background attenuation coefficient per unit length due to effects such as scattering and intervalence band absorption [43].
    Fig. 1. (a) Schematic of a phased array consisting of two laser waveguides, A and B, with each of width 2a and an edge-to-edge separation of 2d. (b) More details about the distribution of refractive indices n1,2, where g represents gain per unit length and α the background attenuation coefficient per unit length due to effects such as scattering and intervalence band absorption [43].
    Stability diagrams of the solitary phased array in the (d/a, γNΔΩ/2π) plane for (a)–(d) P=1.1Pth and (e)–(h) P=2Pth. (a), (e) Purely real index, (b), (f) positive index guiding with gain-guiding, (c), (g) pure gain-guiding, and (d), (h) index antiguiding with gain-guiding. Blue (yellow) stands for stability (instability).
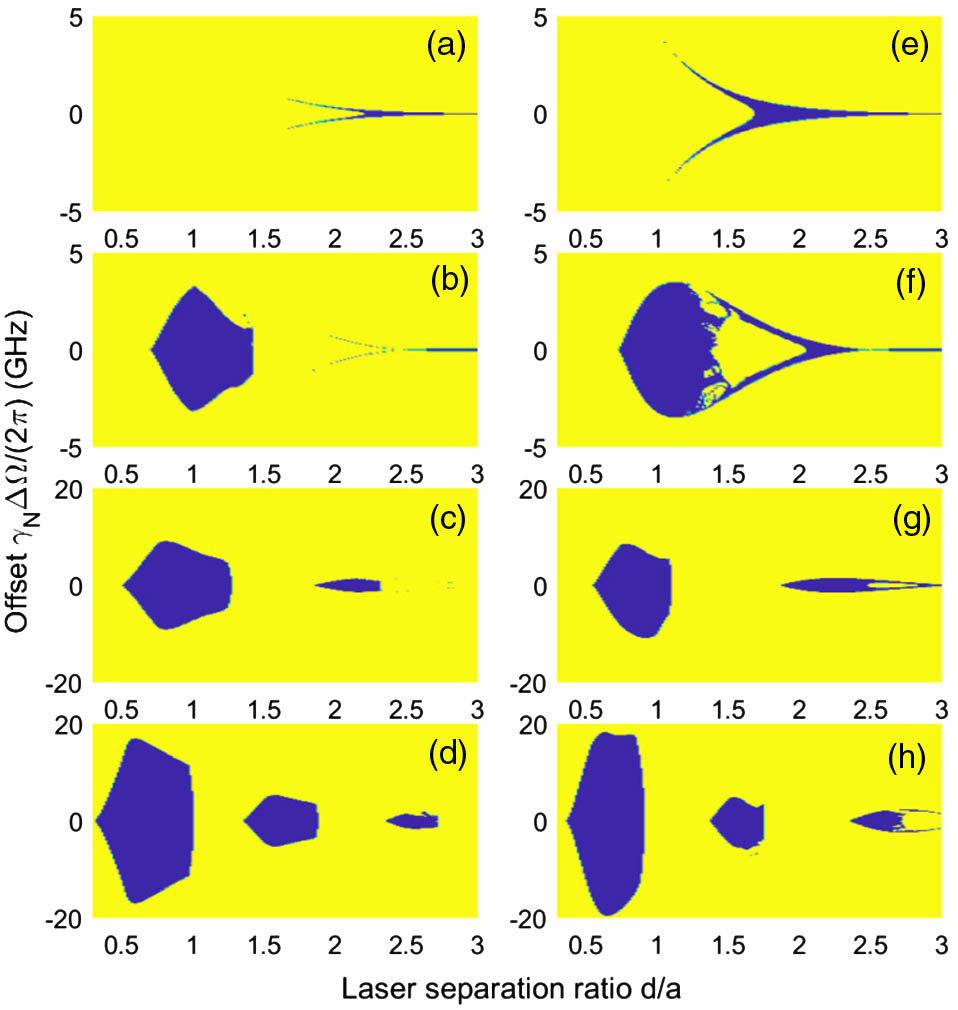
    Fig. 2. Stability diagrams of the solitary phased array in the (d/a, γNΔΩ/2π) plane for (a)–(d) P=1.1Pth and (e)–(h) P=2Pth. (a), (e) Purely real index, (b), (f) positive index guiding with gain-guiding, (c), (g) pure gain-guiding, and (d), (h) index antiguiding with gain-guiding. Blue (yellow) stands for stability (instability).
    Modulation frequency response of the solitary phased array at P=1.1Pth. (a) Purely real index with d/a=2.4, (b) positive index guiding with gain-guiding with d/a=1.35, (c) pure gain-guiding with d/a=1.25, and (d) index antiguiding with gain-guiding with d/a=1.01. Red (blue) represents in-phase (out-of-phase) modulation.
    Fig. 3. Modulation frequency response of the solitary phased array at P=1.1Pth. (a) Purely real index with d/a=2.4, (b) positive index guiding with gain-guiding with d/a=1.35, (c) pure gain-guiding with d/a=1.25, and (d) index antiguiding with gain-guiding with d/a=1.01. Red (blue) represents in-phase (out-of-phase) modulation.
    Modulation frequency response of the solitary phased array at P=2Pth. (a) Purely real index with d/a=1.75, (b) positive index guiding with gain-guiding with d/a=1.3, (c) pure gain-guiding with d/a=1.05, and (d) index antiguiding with gain-guiding with d/a=0.91. Red (blue) represents in-phase (out-of-phase) modulation.
    Fig. 4. Modulation frequency response of the solitary phased array at P=2Pth. (a) Purely real index with d/a=1.75, (b) positive index guiding with gain-guiding with d/a=1.3, (c) pure gain-guiding with d/a=1.05, and (d) index antiguiding with gain-guiding with d/a=0.91. Red (blue) represents in-phase (out-of-phase) modulation.
    Modulation frequency response of the solitary phased array at (a), (b) P=1.1Pth and (c), (d) P=2Pth for index antiguiding with gain-guiding. (a), (b) d/a, 0.5–1.01 and (c), (d) d/a, 0.5–0.91. (a), (c) In-phase modulation and (b), (d) out-of-phase modulation.
    Fig. 5. Modulation frequency response of the solitary phased array at (a), (b) P=1.1Pth and (c), (d) P=2Pth for index antiguiding with gain-guiding. (a), (b) d/a, 0.5–1.01 and (c), (d) d/a, 0.5–0.91. (a), (c) In-phase modulation and (b), (d) out-of-phase modulation.
    Modulation frequency response of the solitary phased array for (a), (b)P=1.1Pth and d/a=0.97, as well as (c), (d) P=2Pth and d/a=0.87 in the case of index antiguiding with gain-guiding. (a), (b) γNΔΩ/2π, 0 to −9 GHz and (c), (d) γNΔΩ/2π, 0 to −10 GHz. (a), (c) In-phase modulation and (b), (d) out-of-phase modulation.
    Fig. 6. Modulation frequency response of the solitary phased array for (a), (b)P=1.1Pth and d/a=0.97, as well as (c), (d) P=2Pth and d/a=0.87 in the case of index antiguiding with gain-guiding. (a), (b) γNΔΩ/2π, 0  to  9  GHz and (c), (d) γNΔΩ/2π, 0  to  10  GHz. (a), (c) In-phase modulation and (b), (d) out-of-phase modulation.
    Modulation frequency response of the solitary phased array for (a) P=1.1Pth and d/a=1.01, as well as (b) P=2Pth and d/a=0.91 in the case of index antiguiding with gain-guiding. Red (blue) represents laser A(B). Here only laser A is modulated.
    Fig. 7. Modulation frequency response of the solitary phased array for (a) P=1.1Pth and d/a=1.01, as well as (b) P=2Pth and d/a=0.91 in the case of index antiguiding with gain-guiding. Red (blue) represents laser A(B). Here only laser A is modulated.
    Stability diagrams of the optically injected phased array in the (K, Δf) plane for (a) P=1.1Pth and d/a=1.01, as well as for (b) P=2Pth and d/a=0.91 in the case of index antiguiding with gain-guiding. Blue (yellow) stands for stability (instability).
    Fig. 8. Stability diagrams of the optically injected phased array in the (K, Δf) plane for (a) P=1.1Pth and d/a=1.01, as well as for (b) P=2Pth and d/a=0.91 in the case of index antiguiding with gain-guiding. Blue (yellow) stands for stability (instability).
    Modulation frequency response of the optically injected phased array for different detuning frequencies Δf and a fixed injection ratio K=200 in the case of index antiguiding with gain-guiding, where (a), (b) P=1.1Pth and d/a=1.01, as well as (c), (d) P=2Pth and d/a=0.91. (a), (c) In-phase modulation and (b), (d) out-of-phase modulation.
    Fig. 9. Modulation frequency response of the optically injected phased array for different detuning frequencies Δf and a fixed injection ratio K=200 in the case of index antiguiding with gain-guiding, where (a), (b) P=1.1Pth and d/a=1.01, as well as (c), (d) P=2Pth and d/a=0.91. (a), (c) In-phase modulation and (b), (d) out-of-phase modulation.
    Modulation frequency response of the optically injected phased array for different injection ratios K and a fixed detuning frequency Δf=0 GHz in the case of index antiguiding with gain-guiding, where P=2Pth and d/a=0.91. (a) In-phase modulation and (b) out-of-phase modulation.
    Fig. 10. Modulation frequency response of the optically injected phased array for different injection ratios K and a fixed detuning frequency Δf=0  GHz in the case of index antiguiding with gain-guiding, where P=2Pth and d/a=0.91. (a) In-phase modulation and (b) out-of-phase modulation.
    Modulation frequency response of the optically injected phased array for (a) P=2Pth and (b) P=5Pth in the case of index antiguiding with gain-guiding. (a) K=160 and (b) K=250. Other parameters are d/a=0.91 and Δf=20 GHz. Red (blue) represents in-phase (out-of-phase) modulation. Horizontal dashed line corresponds to the −3 dB level.
    Fig. 11. Modulation frequency response of the optically injected phased array for (a) P=2Pth and (b) P=5Pth in the case of index antiguiding with gain-guiding. (a) K=160 and (b) K=250. Other parameters are d/a=0.91 and Δf=20  GHz. Red (blue) represents in-phase (out-of-phase) modulation. Horizontal dashed line corresponds to the 3  dB level.
    Modulation frequency response of the master-amplitude-modulated optically injected phased array for different injection ratios K and a fixed detuning frequency Δf=20 GHz in the case of index antiguiding with gain-guiding. Other parameters are P=2Pth and d/a=0.91. Horizontal dashed line corresponds to the −3 dB level.
    Fig. 12. Modulation frequency response of the master-amplitude-modulated optically injected phased array for different injection ratios K and a fixed detuning frequency Δf=20  GHz in the case of index antiguiding with gain-guiding. Other parameters are P=2Pth and d/a=0.91. Horizontal dashed line corresponds to the 3  dB level.
    Δnrgth(cm1)ΔniWrWiΓCη(ns1)Cθ (rad)
    0.0009787.701.2600.84483.60
    0.000590.60.0009371.090.8960.81790.20.233
    099.30.001030.7951.220.74591.90.294
    −0.00051080.001120.6041.610.68596.30.183
    Table 1. Values of Key Parameters for Modeling, Using Material Parameter Values Given in Refs. [43,48]
    Nianqiang Li, H. Susanto, B. R. Cemlyn, I. D. Henning, M. J. Adams. Modulation properties of solitary and optically injected phased-array semiconductor lasers[J]. Photonics Research, 2018, 6(9): 908
    Download Citation