
Yongkang Li, Jingqi Lu, Bing Jiang. Detection of Cadmium in Sunscreen Based on Laser-Induced Breakdown Spectroscopy Technology[J]. Laser & Optoelectronics Progress, 2023, 60(1): 0130005
- Laser & Optoelectronics Progress
- Vol. 60, Issue 1, 0130005 (2023)
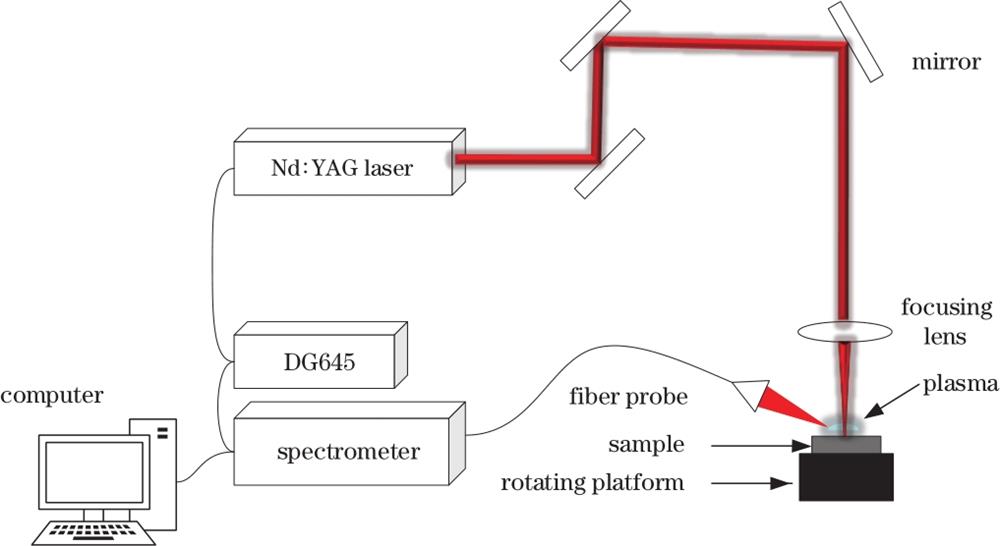
Fig. 1. Diagram of LIBS experimental setup
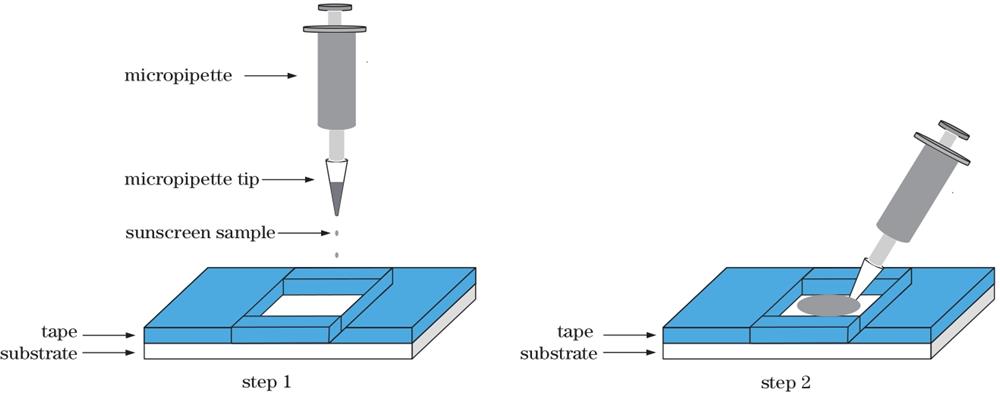
Fig. 2. Sunscreen film sample preparation diagram
Fig. 3. Spectral comparison between the film sample and a clean slide
Fig. 4. Relationship between cadmium line intensity and SNR and film thickness. (a) Cd Ⅱ 214.44 nm; (b) Cd Ⅱ 226.50 nm; (c) Cd Ⅰ 228.80 nm
Fig. 5. Calculating fitting curve of plasma temperature of thin film sample
Fig. 6. Cd spectral intensity map of four substrates
Fig. 7. Linear fitting of Cd spectral line intensity. (a) Cd Ⅱ 214.44 nm; (b) Cd Ⅱ 226.50 nm; (c) Cd Ⅰ 228.80 nm
|
Table 1. Mass ratio of Cd element in sunscreen samples
|
Table 2. Comparison of plasma temperature under different substrates
|
Table 3. Comparison of LOD values obtained from different Cd spectral lines
|
Table 4. Comparison of different cosmetic pretreatment methods and their results
| ||||||||||||||||||||||||||||||||||
Table 5. Comparison of GFAAS detected value and LIBS predicted value of film samples

Set citation alerts for the article
Please enter your email address
© Copyright 2018-2021 | Chinese Laser Press. All Rights Reserved 沪ICP备15018463号-20