
Honggang Xiang, Rui Wang, Jiachao Xi, Xiaocheng Hou, Lichun Liu. Characterization of Speckles in N-Attenuators and Methods for Their Suppression[J]. Acta Optica Sinica, 2021, 41(5): 0508001
- Acta Optica Sinica
- Vol. 41, Issue 5, 0508001 (2021)
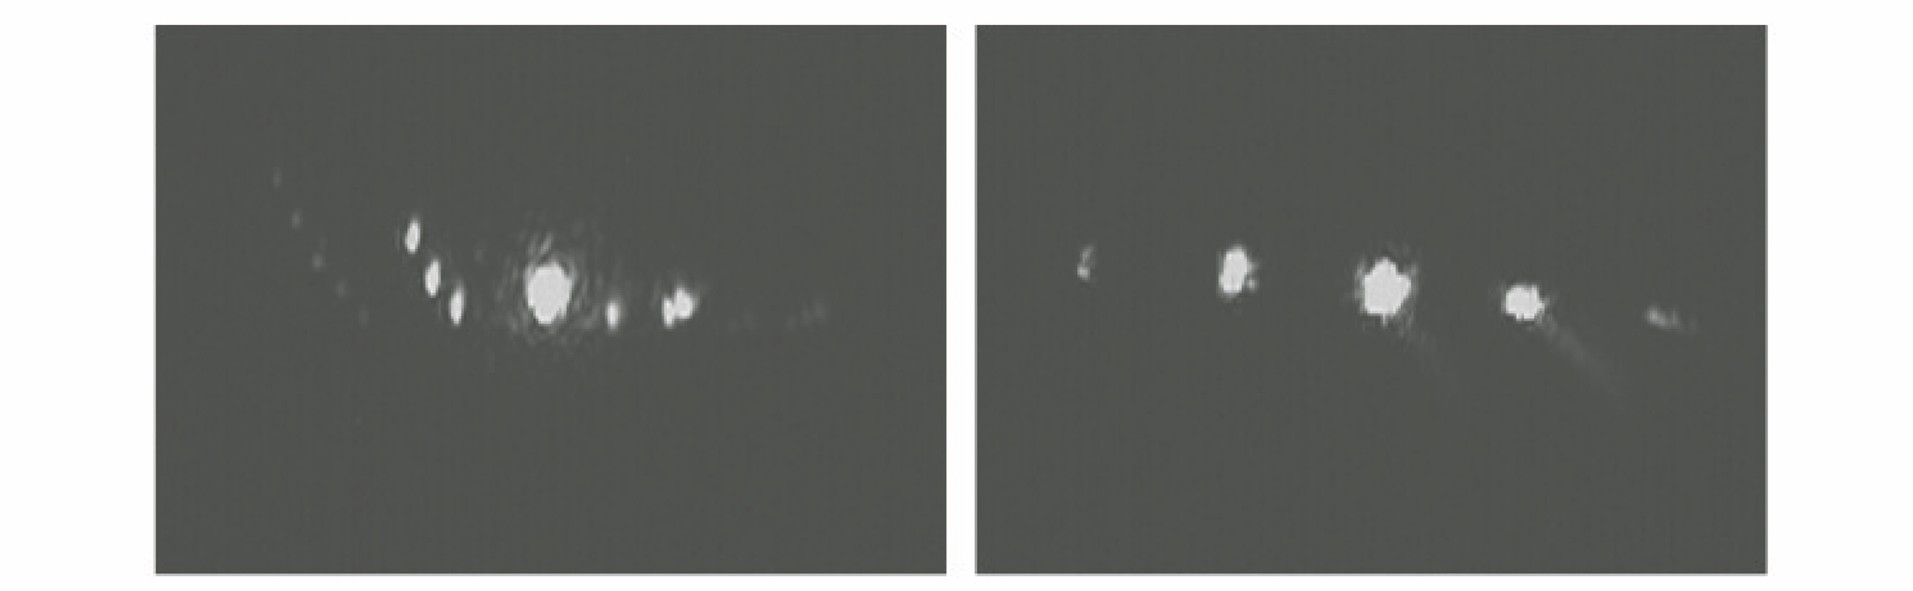
Fig. 1. Schematic of speckles
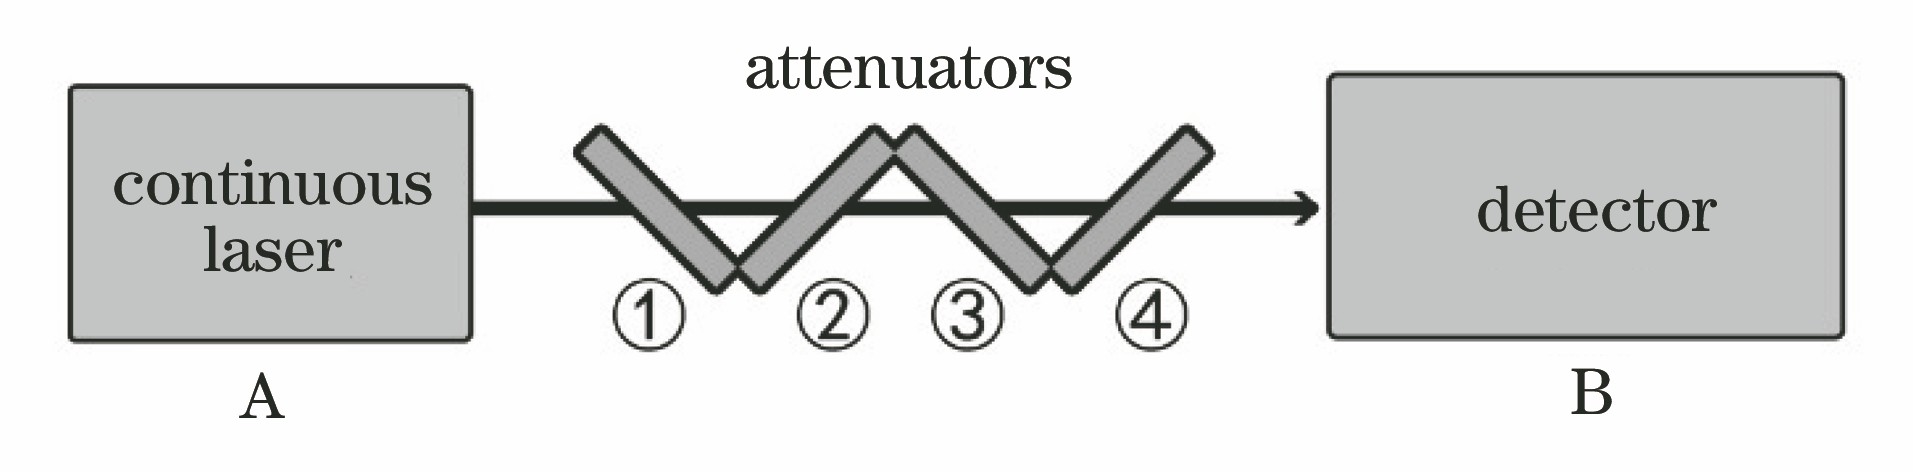
Fig. 2. Schematic of experimental optical path
Fig. 3. Distribution of light spots caused by different placement of attenuators. (a) Experiment 1; (b) experiment 2; (c) experiment 3
Fig. 4. Optical path of a single attenuator
Fig. 5. Analysis of overlap between primary spot and first grade spot
Fig. 6. Optical path for attenuators showing V-shape
Fig. 7. Optical path for parallel attenuators
Fig. 8. When d reaches the maximum value, the incidence angle varies with the relative refractive index
Fig. 9. Change curve of spot center spacing with incident angle in GaF2 medium
Fig. 10. Change curve of spot center spacing with incident angle in K9 glass medium
Fig. 11. Change curve of spot center spacing with attenuator thickness in GaF2 medium
Fig. 12. Change curve of spot center spacing with attenuator thickness in K9 glass medium
Fig. 13. Main spot without speckles
Fig. 14. Placement method 1 and amplification of some details
Fig. 15. Placement method 2 and amplification of some details
Fig. 16. Two groups of attenuators are placed in a double parallel symmetric structure

Set citation alerts for the article
Please enter your email address
© Copyright 2018-2021 | Chinese Laser Press. All Rights Reserved 沪ICP备15018463号-20