
Ying Lu, Zemin Wang, Borui Yang. Calibration of Structured Light Area Based on Distortion Shift Vector[J]. Laser & Optoelectronics Progress, 2022, 59(2): 0214002
- Laser & Optoelectronics Progress
- Vol. 59, Issue 2, 0214002 (2022)
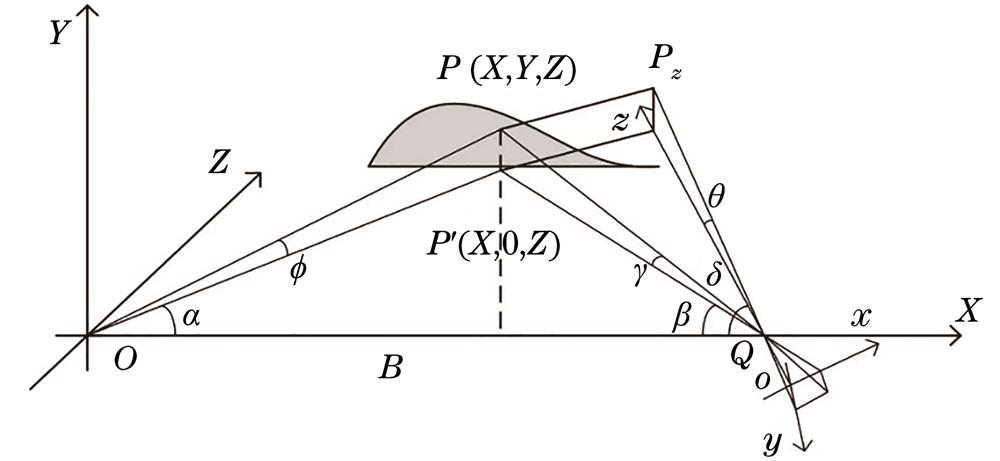
Fig. 1. Triangulation principle of the point structured light
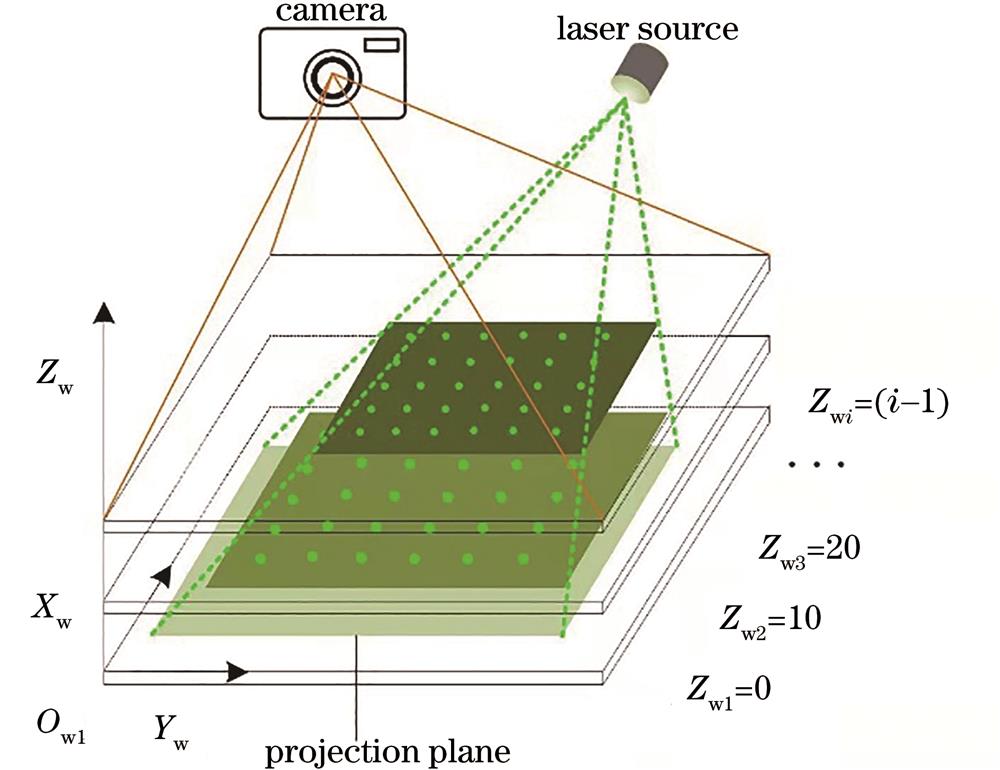
Fig. 2. Principle of the polynomial direct calibration model
Fig. 3. Diagram of the finite element region division
Fig. 4. Area division template. (a) X direction; (b) Y direction
Fig. 5. Division results of subarea calibration
Fig. 6. Physical image of the experimental device
Fig. 7. Residual scatter plot. (a) Plane fitted by the global direct method; (b) residual distribution of the global direct method fitting; (c) plane of the subarea calibration and fitting; (d) residual distribution of the subarea calibration and fitting
Fig. 8. Original image and its three-dimensional spatial distribution. (a) Projection of convex surface; (b) three-dimensional scatter plot of convex surface; (c) projection of concave surface; (d) three-dimensional scatter plot of concave surface
|
Table 1. Radial distortion parameters of the camera unit: pixel
|
Table 2. Coordinate value error of the subarea calibration regression
|
Table 3. RMSE before and after subarea calibration
|
Table 4. Measurement error of the point array laser system

Set citation alerts for the article
Please enter your email address
© Copyright 2018-2021 | Chinese Laser Press. All Rights Reserved 沪ICP备15018463号-20