
Mantas Žurauskas, Aneesh Alex, Jaena Park, Steve R. Hood, Stephen A. Boppart, "Fluorescent nanodiamonds for characterization of nonlinear microscopy systems," Photonics Res. 9, 2309 (2021)
- Photonics Research
- Vol. 9, Issue 12, 2309 (2021)
Abstract
1. INTRODUCTION
Recent advances in nonlinear optical imaging microscopy techniques have increased the adoption of nonlinear imaging modalities that rely on high-intensity illumination for imaging [1–4]. As a result, calibrating the performance of these imaging systems poses a new set of requirements on the “standard samples” that may be used to assess the imaging performance. While a new generation of microscopy calibration targets is under active development [5–7], there is still a need for a convenient and shelf-stable alternative to fluorescent beads that are typically relied on to provide rapid insight into the imaging performance of a microscope.
While there are multiple techniques for assessing and troubleshooting the imaging quality of a multiphoton fluorescence microscope, most of them rely on access to the internal structure of the microscope. A combination of beam profile measurements, polarization, and pulse width, in conjunction with wavefront sensing techniques for assessing the optical system alignment, can provide granular insight into the performance characteristics of a microscope.
At late stages of refining and maintaining a microscopy system, tests based on imaging standard samples are commonly used for benchmarking and fine-tuning. Imaging of commercial fluorescent beads is one of the most common approaches, because point sources can be used for both (A) rapid visual assessment of image quality and (B) quantitative assessment of the point spread function and optical transfer function of the microscope. Fluorescent beads are also suitable for rapid measurements to indicate the presence of aberrations that might be present due to system alignment drift over time.
Sign up for Photonics Research TOC. Get the latest issue of Photonics Research delivered right to you!Sign up now
However, measuring changes in excitation efficiency for different imaging channels is challenging because phantoms that are based on fluorescent dyes are prone to rapid bleaching. To partially counteract this, a fresh imaging sample needs to be prepared each time, which is not only time-consuming but also requires care to be taken to avoid imaging the same beads for too long before they bleach. Bleaching can be slowed through the use of novel fluorescent agents such as quantum dots; however, this only partially solves the issue by extending the imaging time [8], and ultimately quantum dots are still prone to bleaching [9,10].
Fluorescent nanodiamonds have excellent photostability and do not show any signs of bleaching over a period of several hours [10–12]. The fluorescence in nanodiamonds is emitted by the defects in the lattice. Over 500 color centers have been characterized [13], emitting from the deep ultraviolet to the far-infrared ends of the optical spectrum [14]. For our purpose, two color centers are of particular interest because of their commercial availability: the nitrogen-vacancy (NV) and the nitrogen-vacancy-nitrogen (NVN) centers. The emission of an NV center is centered around 680 nm [15], while NVN emission is centered around 580 nm [16]. Fluorescence lifetimes up to a few tens of nanoseconds were reported for fluorescent nanodiamonds prepared using different methods [17]. Additionally, diamond nanoparticles have been shown to produce second-harmonic generation (SHG) and third-harmonic generation (THG) [18,19]. Obviously, due to a high refractive index, they are also visible in reflection and transmission microscopy modes as well [20]. Aforementioned imaging contrast mechanisms are also summarized in Table 1 (Appendix B).
Natural variability of shape and fluorescent properties of individual particles [21] have affected the development of calibration targets that use the fluorescent nanodiamonds as a contrast agent. One way to overcome the variability is through the use of arrays of lithographically defined patterns with clusters of nanodiamonds adherent to the predefined grid patterns [22]. Unfortunately this process could not ensure the presence of single diamonds in specific locations. Alternatively, grids of single color centers can be achieved by using laser writing to create the fluorescent centers inside of bulk diamond [23]. This process, however, is resource-intensive, and the high refractive index of diamond (
Here we propose a nanodiamond-based, shelf-stable imaging phantom, which allows image frequency spectrum analysis for assessing changes in optical transfer function in the microscope. The structure of the phantom also allows intuitive visual assessment of a microscope imaging performance. A stable structure of the phantom does not pose any special requirements for storage conditions. To facilitate the repeated measurements, we have combined a sparse layer of nanodiamonds with a laser-defined grid (Fig. 1). Fluorescent nanodiamonds can provide various forms of contrast simultaneously across SHG, THG, two-photon fluorescence (2PF), three-photon fluorescence (3PF), scattering, and many other imaging techniques and/or modalities. Here, we demonstrate practical implementation of a microscope calibration target that can be used as a reference for microscopy system development purposes. We anticipate that nanodiamond-based calibration targets will be useful for optical instrumentation developers and for imaging facilities to rapidly assess the imaging performance of microscopes. Additionally, we expect that for microscope users, an image of a standard sample taken before each imaging session can provide for quality control of system performance during longitudinal or comparative studies [25–27] or for image normalization during image data analysis.
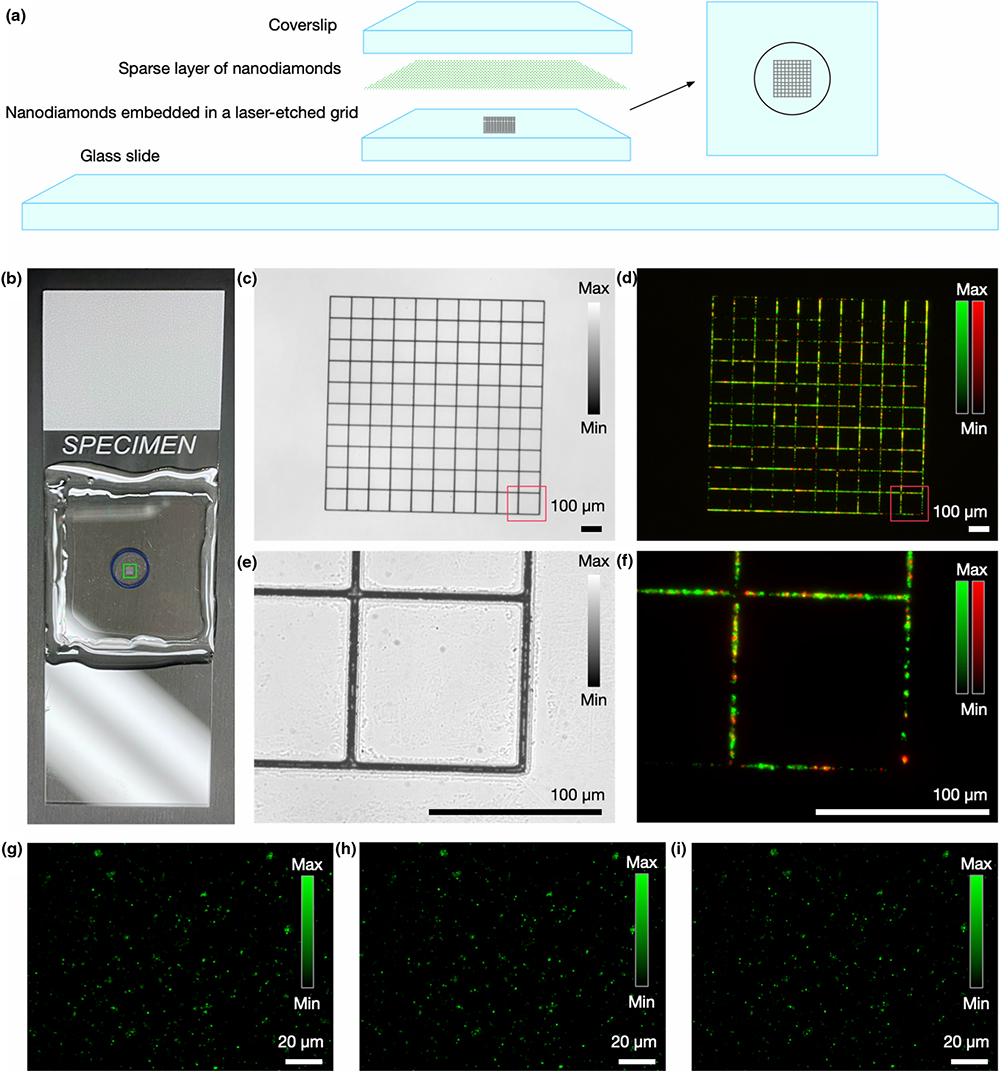
Figure 1.Structure of a nanodiamond based imaging target. (a) The imaging target combines a laser-etched grid with embedded fluorescent nanodiamonds along with a 2D layer of nanodiamonds deposited on a coverslip. A standard microscope slide provides structural support. (b) Photograph of an assembled target. The grid facilitates finding the physical location of the same particles during repeated longitudinal measurements. (c) Laser machined structure is visible in transmission widefield imaging mode. (d) Nanodiamonds embedded in the grid facilitate view finding in fluorescence imaging mode. (e), (f) Magnified images of a portion of the grid. (g)–(i) Images of the layer with sparse randomly distributed 100 nm nanodiamond particles, captured (g) immediately after assembling the phantom, (h) after one month of storage, and (i) after six months of storage. The measured fluorescence intensity for individual particles varied by less than 2%.
2. PRACTICAL IMPLEMENTATION AND CHARACTERIZATION OF THE IMAGING PHANTOM
A. Structure of the Phantom
For the demonstration presented in this paper, we have selected a design where a pair of two-dimensional nanodiamond layers is supported by a glass structure [Figs. 1(a) and 1(b)]. This configuration is robust against handling and permits imaging with microscopy objectives that are compatible with standard 170 μm coverslips. The structure of the phantom contains two distinct layers. The first is a 2D nanodiamond layer where single nanodiamond particles are dispersed sparsely and randomly, which is used for imaging quality characterization. A second adjacent 2D layer has nanodiamonds arranged in a grid pattern, which is used for calibrating
The grid layer consists of a glass coverslip (Millennium Sciences, DRM 800) with a laser-etched
![]()
Figure 2.Simultaneous four-channel multiphoton imaging of different types of calibration targets. (a) A dense lawn of 100 nm nanodiamond particles with NV color centers. (b) Locator grid with embedded 100 nm nanodiamonds is strongly visible in purple as well as in red channels. (c) Sparse nanodiamond particles deposited on a coverslip. (d) Locator grid with embedded 700 nm nanodiamond particles.
A nanodiamond layer is prepared by dispersing single nanodiamond particles on a glass surface. Two types of nanodiamonds were used in this paper: 0.1 μm (900174, Sigma-Aldrich) and 0.7 μm (MDNVN1umHi30mg, Adamas Nanotechnologies). For nanodiamond deposition, a solution of nanodiamonds in deionized water was prepared (0.001 mg/mL for 0.1 μm particles and 0.01 mg/mL for 0.7 μm particles) and sonicated for 1 h. A 10 μL sample of the sonicated solution was deposited on a clean coverslip (No. 1, 2845-22, Corning), and the coverslips were allowed to dry at room temperature. The dried coverslips were washed under a stream of deionized water to remove loose particles and then dried again. As a result, a sparse layer with randomly distributed nanoparticles was obtained. The nanoparticle layers prepared in this way were attached to the glass and were stable for imaging purposes, without the use of additional binding agents that can cause undesirable background fluorescence signals.
The coverslip with the nanodiamond layer, the coverslip with the grid pattern, and the microscope slide (12-544-7, Fisher Scientific) were carefully aligned and positioned as depicted in Fig. 1(a). The edges around the coverslips were sealed with UVF-curable optical adhesive (No. 63, 6301, Norland Products) and cured under UV light for at least 8 h to form a water- and oil-proof seal. The resulting air gap between the grid and the random nanodiamond layer was approximately 40 μm. The thickness of the air gap varied slightly from sample to sample.
The nanodiamond layer is protected from the environment by its structure. Figures 1(g)–1(i) illustrate that the same particles can be found during repeated measurements, recorded several months apart. For repeated measurements at approximately the same location presented in Figs. 1(g)–1(i), the imaging location was identified by using a grid. Then the microscope was refocused to the layer with randomly deposited nanoparticles. The measured fluorescence intensity for individual particles varied by less than 2% across these measurements.
B. Nonlinear Multichannel Imaging
To demonstrate multimodal imaging of nanodiamonds using nonlinear excitation (Fig. 2), we used a setup described previously in Ref. [2]. Briefly, fluorescence excitation was achieved with a supercontinuum from a photonic crystal fiber (PM-LMA-15, NKT Photonics) that was pumped with a fiber laser (Satsuma, Amplitude Systemes) operated at 10 MHz. The
In this example, four imaging channels contain the nonlinear imaging signals from four modalities: SHG, THG signals generated by nanodiamonds, and fluorescence from NV and NVN color centers. Channel A contains a predominant THG signal. Channel B contains part of the fluorescence signal from the NVN color centers. Channel C contains a strong contribution from the NVN and a small contribution from the NV color centers and the SHG component. Channel D mostly captures the NV fluorescence with a minor contribution from the NVN color centers. With 1110 nm illumination, the fluorescence from the NV color centers is excited through two-photon excitation, while both two- and three-photon excitations are likely to contribute toward the excitation of the NVN color centers.
Figure 2 shows two different calibration targets. In Fig. 2(a), the dominant signal comes from NV color centers of 100 nm nanodiamonds, while in the grid, the THG component generated by the glass–air interface and clusters of nanodiamonds dominates. In Fig. 2(c), signal is detected across all the channels and therefore appears white in a merged image for a few sparsely distributed 700 nm particles. The grid layer in Fig. 2(d) shows signals from nanodiamonds embedded in the grid, with a variety of unique spectral signatures and the distribution of the emitters in the defined and distinctive grid pattern.
C. Fluorescence Lifetime Imaging
Fluorescent nanodiamonds are compatible with fluorescence lifetime measurements. Here we demonstrate the fluorescence lifetime measurements captured with the system previously described in detail in Ref. [28].
The excitation light was obtained by pumping a nonlinear photonic crystal fiber (PCF, LMA-PM-15, NKT Photonics) using a high-power femtosecond laser centered at 1040 nm (Femtotrain, Spectra-Physics, 10 MHz, 370 fs, USA), resulting in a pulse with a central wavelength of 1110 nm and a bandwidth of 150 nm. The fluorescence light at the spectral window defined by the optical bandpass filter from 405 to 504 nm (FF01-451/106-25, Semrock) was detected using a low-noise hybrid photon counting photodetector with a photomultiplier tube. A time-correlated single-photon counting unit (HydraHarp 400, PicoQuant GmbH) was used for fluorescence lifetime imaging (FLIM) signal acquisition.
The fluorescence lifetime measurements are depicted in Fig. 3. In Fig. 3(a), the fluorescence lifetime was calculated using the “Fast FLIM” function in commercial software (Symphotime 64, Picoquant GmbH, Germany). Here, the estimated average fluorescence lifetimes for individual particles vary; however, most nanoparticles have a lifetime slightly below 30 ns. Figure 3(b) shows a fluorescence decay curve for the whole field of view. These results are in line with previous demonstrations of fluorescence lifetime measurements [22,29,30].
![]()
Figure 3.Fluorescence lifetime measurements. (a) A layer of nanodiamond particles with fluorescent centers deposited on glass can be used as a reference for assessing the fluorescence lifetime imaging performance of microscopy systems. (b) Overall fluorescence decay from all nanoparticles across the field of view. The inset in (b) shows representative examples of decay curves measured for individual particles.
D. Photostability
A key property of the fluorescent nanodiamonds, which makes them interesting for the application in the development of calibration targets, is that they exhibit a stable fluorescence over time without being affected by photobleaching [14].
To illustrate the photostability of the fluorescent nanodiamond-based phantom, we have imaged two samples, one with nanodiamonds and the other with fluorescent beads, using the same fluorescence excitation conditions. The wide-field single-photon fluorescence measurements were chosen to minimize the effects of system drift on the long-term measurements [31]. The fluorescence images (620/60 nm excitation; 700/75 nm detection) were captured using a Zeiss Plan-Apochromat
![]()
Figure 4.Bleaching in fluorescent beads and in fluorescent nanodiamonds. Fluorescence microscopy images of (a) fluorescent beads and (c) fluorescent nanodiamonds deposited on the glass. (b) Fluorescent dyes in beads decay exponentially as a function of time, due to photobleaching. (d) Fluorescence of color centers in the diamond particles remains stable over time.
In contrast, the fluorescence from 0.1 μm nanodiamonds (900174, Sigma-Aldrich) remains stable [Figs. 4(c) and 4(d)]. Also, it is worth noting that during the preparation of the phantom, the nanodiamonds in the phantom were exposed to UV light for at least 8 h, while the fluorescent beads were protected from light until the experiment.
3. QUANTIFICATION OF IMAGE DATA FOR OPTICAL SYSTEM CHARACTERIZATION
An image contains information both about the object and about the imaging system that was used for imaging. When an object contains features that are smaller than the size of the point spread function (PSF) of an imaging system, an image of an object can be used for sampling the optical transfer function (OTF) of the imaging instrument [32]. While normally there is no direct access to OTF measurements, the image spatial frequency spectrum may provide a proxy if a wide spread of spatial frequencies is present in the object [33]. A layer of fluorescent nanodiamonds that are deposited randomly [Fig. 5(a)] is suitable for this type of measurement.
![]()
Figure 5.Dense random lawn of nanodiamonds for assessing imaging system performance. (a) A dense layer of subresolution 100 nm nanodiamond particles with NV centers deposited on glass can be used for rapid assessment of imaging performance of microscopy systems. (b) FFT of (a) reveals the broad frequency content of the image with no directionally ordered features. (c) The radial profile of (b) provides a rapid proxy for modulation transfer function measurements. The inset in (c) shows a schematic example representing a drop of imaging quality in a compromised optical system; (d) and (e) show lateral and axial slices, respectively, from a captured volume containing a single particle.
While the fast Fourier transform (FFT) of an imaging phantom [Fig. 5(b)] contains more information about the optical transfer function, a radial profile of the values [Fig. 5(b)] provides an easier reference for rapid evaluation. Here, an azimuthal integration of frequency-domain components in the Fourier spectrum of an image
4. DISCUSSION AND CONCLUSIONS
The optical performance of a system can be evaluated both visually and quantitatively by imaging a 3D nanodiamond-based imaging phantom. A single image of a dense layer of randomly distributed nanodiamonds, positioned at the focal plane of a microscope, can provide information for rapid assessment of system performance. Also, the parameters such as the uniformity of the fluorescence intensity across a field of view can reveal vignetting and imaging plane curvature. The average intensity value from a fraction of the top intensity values could offer insights about signal excitation efficiency, while the low baseline values could indicate background noise from environmental illumination in the system.
One of the purposes of the square grid is to facilitate finding the same area during repeated imaging events. However, it can also serve as a microscopic ruler for measuring the size of the area being imaged. Further functionality can be achieved by replacing the grid with different geometries, such as Siemens star or a USAF resolution test chart.
The fluorescence lifetime measurements may be useful for comparing the measurements that can be achieved on different systems. Also, these measurements could be used to evaluate when assessing the system operating with different illumination levels or when optimizing other system or imaging parameters.
The optical quality of an imaging system and the presence of aberrations due to a system drift over time can be easily detected by assessing changes in the spatial frequency spectrum over time while imaging the same location of a dense lawn of randomly distributed subresolution nanodiamonds. While this can be performed as a quick visual check, the measurement is also highly amenable to automation. Also, while in this paper we focus on using nonuniform nanoparticles, it would be very desirable to replace them with uniform nanodiamonds that are subresolution, as this would allow direct measurements of the PSF.
Further development of the target is necessary to explore the potential of embedding the fluorescent nanodiamonds into a 3D volume. Key challenges here will be to identify the materials that do not generate significant background signal in the optical channels of interest. Therefore, we anticipate that the 3D substrate will be customized for compatibility with specific imaging system types as opposed to a universal solution.
We anticipate that nanodiamond-based phantoms will be valuable for developing and maintaining adaptive optics-based microscopy systems that rely on image quality metrics for estimating the optical wavefront [34]. Here, the stable fluorescence signal coupled with good spatial frequency coverage in the object plane will improve the accuracy of iterative measurements when calibrating the adaptive element and measuring the system-induced aberrations.
The requirement of the particle density in the random lawn is determined by a compromise between the required signal-to-noise ratio and the quality of the optical system that is being used for imaging. A single subresolution particle at the center of the field of view would provide adequate sampling across the range of relevant spatial frequencies. Increasing the number of particles in the field of view facilitates measurements by improving the signal-to-noise ratio. However, low spatial frequencies are boosted more than high spatial frequencies as more and more particles are being added. The presence of particle aggregates further exaggerates this effect. In practice, we have observed that several dozens of particles in a single field of view offer a good compromise between accuracy and ease of use. The presence of aggregates can be mitigated by imaging the same area during successive measurements. Alternatively, to achieve strong signal, the particles that are larger than the diffraction limit can be used, as long as they have irregular shapes with features smaller than diffraction limit of the imaging system.
While we have explored in this paper nanodiamonds containing two types of color centers (NV and NVN), other color centers are also actively being developed [35]. Specifically, nanodiamonds containing N3 are emerging as a commercially available product [36] that emit fluorescence centered at 450 nm, providing coverage for the blue end of the spectrum. The improved availability of alternative color centers will allow for good coverage across the visible optical spectrum.
Fluorescent nanodiamonds can also provide optical contrast in a variety of optical microscopy techniques. The use of nanodiamonds in STED [16] and STORM [37] super-resolution microscopy techniques has been reported. These super-resolution imaging techniques are particularly sensitive to photobleaching; therefore, we anticipate that nanodiamond-based imaging phantom could be integrated into system development and maintenance pipelines for these systems.
In conclusion, a fluorescent nanodiamond-based optical phantom has been developed and demonstrated to be a stable and useful tool for characterizing optical performance of microscopy systems. In this paper we demonstrated and evaluated the practical implementation of a nanodiamond-based imaging phantom. Individual diamond nanoparticles have unique optical signatures and shapes. However, in combination with a view-finding reference grid, the same nanodiamonds, or the same areas containing a lawn of nanodiamonds, can be found repeatedly and imaged over long periods of time. Nanodiamonds have near-infinite photostability and can serve as a contrast agent for a wide variety of optical microscopy system types. Because of these properties, our imaging phantom provides a stable, low-maintenance, and easy-to use alternative to other imaging system characterization methods. As a result, we anticipate that nanodiamond-based imaging targets and phantoms will have the potential to be widely adopted in microscopy laboratories and imaging facilities as a standard calibration and characterization tool.
Acknowledgment
Acknowledgment. The authors thank Marina Marjanovic and Darold Spillman Jr. for administrative support, and Prabuddha Mukherjee for helpful discussions. Additional information can be found at http://biophotonics.illinois.edu.
APPENDIX A: RESPONSE TO A MAGNETIC FIELD
Nanodiamonds with NV centers are sensitive to a magnetic field [
An important property of NV centers is that they have a triplet ground-state electronic configuration that leads to unique optical properties, including the ability to modulate the intensity of NV fluorescence by applying a weak radio-frequency field and/or a static magnetic field. In the presence of a magnetic field, the states
To illustrate the possibility of modulating the fluorescence intensity in the fluorescent nanodiamonds, we prepared and used a phantom with 0.1 μm nanodiamonds (900174, Sigma-Aldrich), which was combined with a custom-built miniature electromagnetic coil as shown in Figs.
![]()
Figure 6.Modulation of nanodiamond fluorescence intensity with a magnetic field. (a), (b) A miniature electromagnetic coil can be positioned near the nanodiamond layer. (c) Fluorescence intensity, as measured with a widefield fluorescence microscope, is significantly reduced in the presence of a magnetic field. (d) The modulation is not observed when the same field is applied to the fluorescent beads.
Appendix B: SUMMARY OF CONTRAST MECHANISMS IN FLUORESCENT NANODIAMONDS
The fluorescent nanodiamonds can provide a variety of contrast mechanisms for imaging and sensing. Table
Sources of Contrast in Nanodiamonds
| Source of Contrast | Fluorescence | FLIM | Scattering | SHG | THG | Raman |
|---|---|---|---|---|---|---|
| Diamond Crystal | [ | |||||
| Interfaces | [ | [ | ||||
| Colour Centers | [ | [ | [ |
Fluorescent nanodiamonds can be seen in multiple imaging modalities. Various contrast mechanisms stemming either from color centers, interfaces between the diamond and surrounding environment, or simply from the diamond lattice itself, allow imaging using either single- or multi-photon fluorescence, fluorescence lifetime imaging (FLIM), scattering, second-harmonic generation (SHG), third-harmonic generation (THG), or Raman microscopy.
References
[1] N. Mazumder, N. K. Balla, G.-Y. Zhuo, Y. V. Kistenev, R. Kumar, F.-J. Kao, S. Brasselet, V. V. Nikolaev, N. A. Krivova. Label-free non-linear multimodal optical microscopy-basics, development, and applications. Front. Phys., 7, 170(2019).
[2] S. You, R. Barkalifa, E. J. Chaney, H. Tu, J. Park, J. E. Sorrells, Y. Sun, Y.-Z. Liu, L. Yang, D. Z. Chen, M. Marjanovic, S. Sinha, S. A. Boppart. Label-free visualization and characterization of extracellular vesicles in breast cancer. Proc. Natl. Acad. Sci. USA, 116, 24012-24018(2019).
[3] M. Žurauskas, O. Barnstedt, M. Frade-Rodriguez, S. Waddell, M. J. Booth. Rapid adaptive remote focusing microscope for sensing of volumetric neural activity. Biomed. Opt. Express, 8, 4369-4379(2017).
[4] Y.-Z. Liu, C. Renteria, C. D. Courtney, B. Ibrahim, S. You, E. J. Chaney, R. Barkalifa, R. R. Iyer, M. Žurauskas, H. Tu, D. Llano, C. A. Christian-Hinman, S. A. Boppart. Simultaneous two-photon activation and imaging of neural activity based on spectral–temporal modulation of supercontinuum light. Neurophotonics, 7, 045007(2020).
[5] A. Royon, N. Converset. Quality control of fluorescence imaging systems: a new tool for performance assessment and monitoring. Opt. Photonik, 12, 22-25(2017).
[6] R. Lin, A. H. Clowsley, T. Lutz, D. Baddeley, C. Soeller. 3D super-resolution microscopy performance and quantitative analysis assessment using DNA-PAINT and DNA origami test samples. Methods, 174, 56-71(2020).
[7] A. D. Corbett, M. Shaw, A. Yacoot, A. Jefferson, L. Schermelleh, T. Wilson, M. Booth, P. S. Salter. Microscope calibration using laser written fluorescence. Opt. Express, 26, 21887-21899(2018).
[8] U. Resch-Genger, M. Grabolle, S. Cavaliere-Jaricot, R. Nitschke, T. Nann. Quantum dots versus organic dyes as fluorescent labels. Nat. Methods, 5, 763-775(2008).
[9] G. Grimaldi, J. J. Geuchies, W. Van Der Stam, I. Du Fossé, B. Brynjarsson, N. Kirkwood, S. Kinge, L. D. Siebbeles, A. J. Houtepen. Spectroscopic evidence for the contribution of holes to the bleach of Cd-chalcogenide quantum dots. Nano Lett., 19, 3002-3010(2019).
[10] P. Reineck, A. Francis, A. Orth, D. W. M. Lau, R. D. V. Nixon-Luke, I. D. Rastogi, W. A. W. Razali, N. M. Cordina, L. M. Parker, V. K. A. Sreenivasan, L. J. Brown, B. C. Gibson. Brightness and photostability of emerging red and near-IR fluorescent nanomaterials for bioimaging. Adv. Opt. Mater., 4, 1549-1557(2016).
[11] S.-J. Yu, M.-W. Kang, H.-C. Chang, K.-M. Chen, Y.-C. Yu. Bright fluorescent nanodiamonds: no photobleaching and low cytotoxicity. J. Am. Chem. Soc., 127, 17604-17605(2005).
[12] S. Hemelaar, P. De Boer, M. Chipaux, W. Zuidema, T. Hamoh, F. P. Martinez, A. Nagl, J. Hoogenboom, B. Giepmans, R. Schirhagl. Nanodiamonds as multi-purpose labels for microscopy. Sci. Rep., 7, 1(2017).
[13] A. Zaitsev. Vibronic spectra of impurity-related optical centers in diamond. Phys. Rev. B, 61, 12909-12922(2000).
[14] M. H. Alkahtani, F. Alghannam, L. Jiang, A. Almethen, A. A. Rampersaud, R. Brick, C. L. Gomes, M. O. Scully, P. R. Hemmer. Fluorescent nanodiamonds: past, present, and future. Nanophotonics, 7, 1423-1453(2018).
[15] E. Fraczek, V. G. Savitski, M. Dale, B. G. Breeze, P. Diggle, M. Markham, A. Bennett, H. Dhillon, M. E. Newton, A. J. Kemp. Laser spectroscopy of NV− and NV0 colour centres in synthetic diamond. Opt. Mater. Express, 7, 2571-2585(2017).
[16] G. Laporte, D. Psaltis. STED imaging of green fluorescent nanodiamonds containing nitrogen-vacancy-nitrogen centers. Biomed. Opt. Express, 7, 34-44(2016).
[17] C. Laube, T. Oeckinghaus, J. Lehnert, J. Griebel, W. Knolle, A. Denisenko, A. Kahnt, J. Meijer, J. Wrachtrup, B. Abel. Controlling the fluorescence properties of nitrogen vacancy centers in nanodiamonds. Nanoscale, 11, 1770-1783(2019).
[18] F. Trojánek, K. Ždek, B. Dzurňák, M. Kozák, P. Malý. Nonlinear optical properties of nanocrystalline diamond. Opt. Express, 18, 1349-1357(2010).
[19] M. Kozák, F. Trojánek, B. Rezek, A. Kromka, P. Malý. Optical harmonic generation in nanocrystalline diamond. Phys. E, 44, 1300-1303(2012).
[20] V. Pichot, O. Muller, A. Seve, A. Yvon, L. Merlat, D. Spitzer. Optical properties of functionalized nanodiamonds. Sci. Rep., 7, 14086(2017).
[21] V. N. Mochalin, O. Shenderova, D. Ho, Y. Gogotsi. The properties and applications of nanodiamonds. Nat. Nanotechnol., 7, 11-23(2012).
[22] A. H. Heffernan, A. D. Greentree, B. C. Gibson. Nanodiamond arrays on glass for quantification and fluorescence characterisation. Sci. Rep., 7, 9252(2017).
[23] Y.-C. Chen, P. S. Salter, S. Knauer, L. Weng, A. C. Frangeskou, C. J. Stephen, S. N. Ishmael, P. R. Dolan, S. Johnson, B. L. Green, G. W. Morley, M. E. Newton, J. G. Rarity, M. J. Booth, J. M. Smith. Laser writing of coherent colour centres in diamond. Nat. Photonics, 11, 77-80(2017).
[24] T. Ruf, M. Cardona, C. Pickles, R. Sussmann. Temperature dependence of the refractive index of diamond up to 925 K. Phys. Rev. B, 62, 16578-16581(2000).
[25] M. Žurauskas, R. Barkalifa, A. Alex, M. Marjanovic, D. R. Spillman, P. Mukherjee, C. D. Neitzel, W. Lee, J. Medler, Z. Arp, M. Cleveland, S. Hood, S. A. Boppart. Assessing the severity of psoriasis through multivariate analysis of optical images from non-lesional skin. Sci. Rep., 10, 1(2020).
[26] A. Alex, E. J. Chaney, M. Žurauskas, J. M. Criley, D. R. Spillman, P. B. Hutchison, J. Li, M. Marjanovic, S. Frey, Z. Arp, S. A. Boppart.
[27] S. M. Sternisha, P. Mukherjee, A. Alex, E. J. Chaney, R. Barkalifa, B. Wan, J. H. Lee, J. Rico-Jimenez, M. Žurauskas, D. R. Spillman, S. A. Sripada, M. Marjanovic, Z. Arp, S. S. Galosy, D. S. Bhanushali, S. R. Hood, S. Bose, S. A. Boppart. Longitudinal monitoring of cell metabolism in biopharmaceutical production using label-free fluorescence lifetime imaging microscopy. Biotechnol. J., 16, e2000629(2021).
[28] J. H. Lee, J. J. Rico-Jimenez, C. Zhang, A. Alex, E. J. Chaney, R. Barkalifa, D. R. Spillman, M. Marjanovic, Z. Arp, S. R. Hood, S. A. Boppart. Simultaneous label-free autofluorescence and multi-harmonic imaging reveals
[29] J. Tisler, G. Balasubramanian, B. Naydenov, R. Kolesov, B. Grotz, R. Reuter, J.-P. Boudou, P. A. Curmi, M. Sennour, A. Thorel, M. Börsch, K. Aulenbacher, R. Erdmann, P. R. Hemmer, F. Jelezko, J. Wrachtrup. Fluorescence and spin properties of defects in single digit nanodiamonds. ACS Nano, 3, 1959-1965(2009).
[30] D. G. Monticone, F. Quercioli, R. Mercatelli, S. Soria, S. Borini, T. Poli, M. Vannoni, E. Vittone, P. Olivero. Systematic study of defect-related quenching of NV luminescence in diamond with time-correlated single-photon counting spectroscopy. Phys. Rev. B, 88, 155201(2013).
[31] W. Colomb, J. Czerski, J. Sau, S. K. Sarkar. Estimation of microscope drift using fluorescent nanodiamonds as fiducial markers. J. Microsc., 266, 298-306(2017).
[32] N. Meitav, E. N. Ribak, S. Shoham. Point spread function estimation from projected speckle illumination. Light: Sci. Appl., 5, e16048(2016).
[33] M. Žurauskas, I. M. Dobbie, R. M. Parton, M. A. Phillips, A. Göhler, I. Davis, M. J. Booth. Isosense: frequency enhanced sensorless adaptive optics through structured illumination. Optica, 6, 370-379(2019).
[34] M. Booth, D. Andrade, D. Burke, B. Patton, M. Žurauskas. Aberrations and adaptive optics in super-resolution microscopy. Microscopy, 64, 251-261(2015).
[35] M. D. Torelli, N. A. Nunn, O. A. Shenderova. A perspective on fluorescent nanodiamond bioimaging. Small, 15, 1902151(2019).
[36] N. Nunn, N. Prabhakar, P. Reineck, V. Magidson, E. Kamiya, W. F. Heinz, M. D. Torelli, J. Rosenholm, A. Zaitsev, O. Shenderova. Brilliant blue, green, yellow, and red fluorescent diamond particles: synthesis, characterization, and multiplex imaging demonstrations. Nanoscale, 11, 11584-11595(2019).
[38] S. K. Singam, J. Motylewski, A. Monaco, E. Gjorgievska, E. Bourgeois, M. Nesládek, M. Giugliano, E. Goovaerts. Contrast induced by a static magnetic field for improved detection in nanodiamond fluorescence microscopy. Phys. Rev. Appl., 6, 064013(2016).
[39] Z. R. Jones, N. J. Niemuth, M. E. Robinson, O. A. Shenderova, R. D. Klaper, R. J. Hamers. Selective imaging of diamond nanoparticles within complex matrices using magnetically induced fluorescence contrast. Environ. Sci. Nano, 7, 525-534(2020).
[40] M. Capelli, P. Reineck, D. W. Lau, A. Orth, J. Jeske, M. Doherty, T. Ohshima, A. D. Greentree, B. C. Gibson. Magnetic field-induced enhancement of the nitrogen-vacancy fluorescence quantum yield. Nanoscale, 9, 9299-9304(2017).
[41] L. J. Rogers, M. W. Doherty, M. S. Barson, S. Onoda, T. Ohshima, N. B. Manson. Singlet levels of the NV- centre in diamond. New J. Phys., 17, 013048(2015).
[42] A. Kuwahata, T. Kitaizumi, K. Saichi, T. Sato, R. Igarashi, T. Ohshima, Y. Masuyama, T. Iwasaki, M. Hatano, F. Jelezko, M. Kusakabe, T. Yatsui, M. Sekino. Magnetometer with nitrogen-vacancy center in a bulk diamond for detecting magnetic nanoparticles in biomedical applications. Sci. Rep., 10, 2483(2020).
[43] C.-D. Frese, S. Schiller. 3D tomographic magnetofluorescence imaging of nanodiamonds. Biomed. Opt. Express, 11, 533-553(2020).
[44] I. Pope, L. Payne, G. Zoriniants, E. Thomas, O. Williams, P. Watson, W. Langbein, P. Borri. Coherent anti-Stokes Raman scattering microscopy of single nanodiamonds. Nat. Nanotechnol., 9, 940-946(2014).
[45] A. Abulikemu, Y. Kainuma, T. An, M. Hase. Second-harmonic generation in bulk diamond based on inversion symmetry breaking by color centers. ACS Photon., 8, 988-993(2021).


Set citation alerts for the article
Please enter your email address

© Copyright 2018-2021 | Chinese Laser Press. All Rights Reserved 沪ICP备15018463号-20