
Shuai Yu, Xili Wang. Remote Sensing Image Segmentation Method Based on Multi-Level Channel Attention[J]. Laser & Optoelectronics Progress, 2020, 57(4): 041012
- Laser & Optoelectronics Progress
- Vol. 57, Issue 4, 041012 (2020)
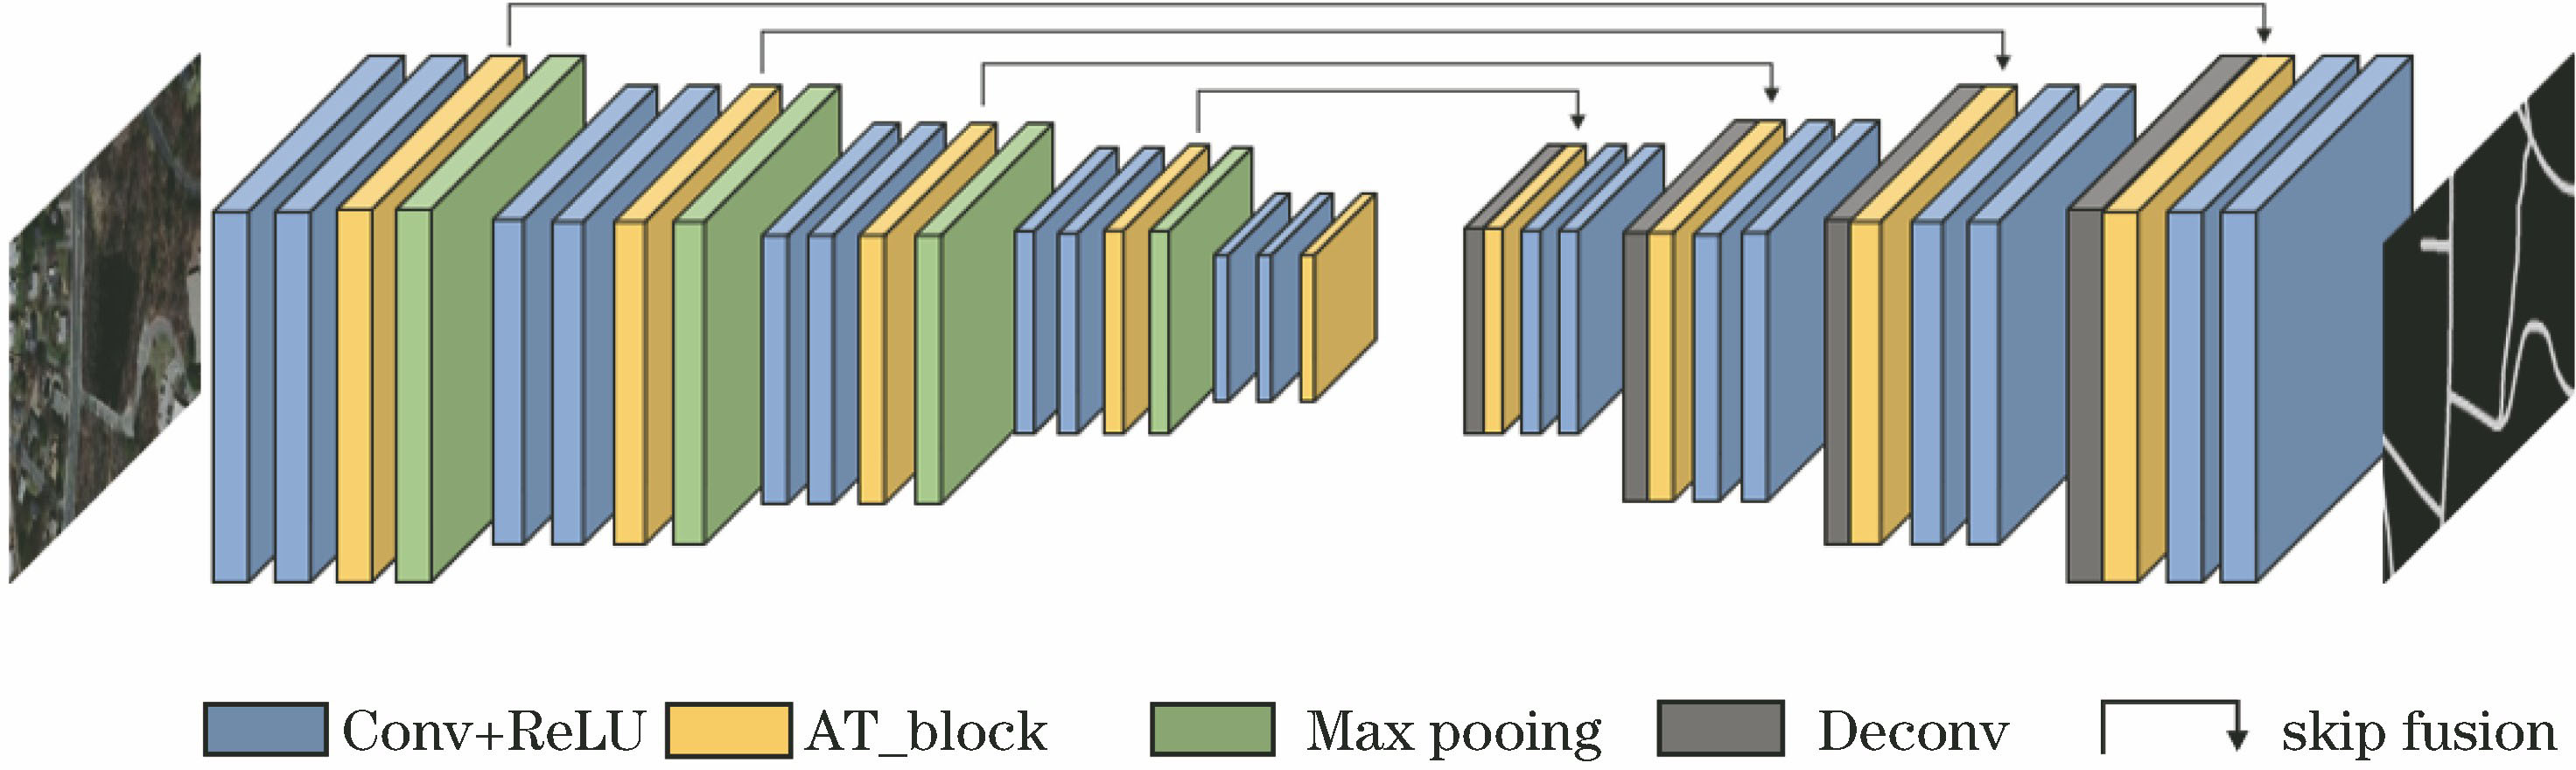
Fig. 1. Structure of RSIS-MLCA
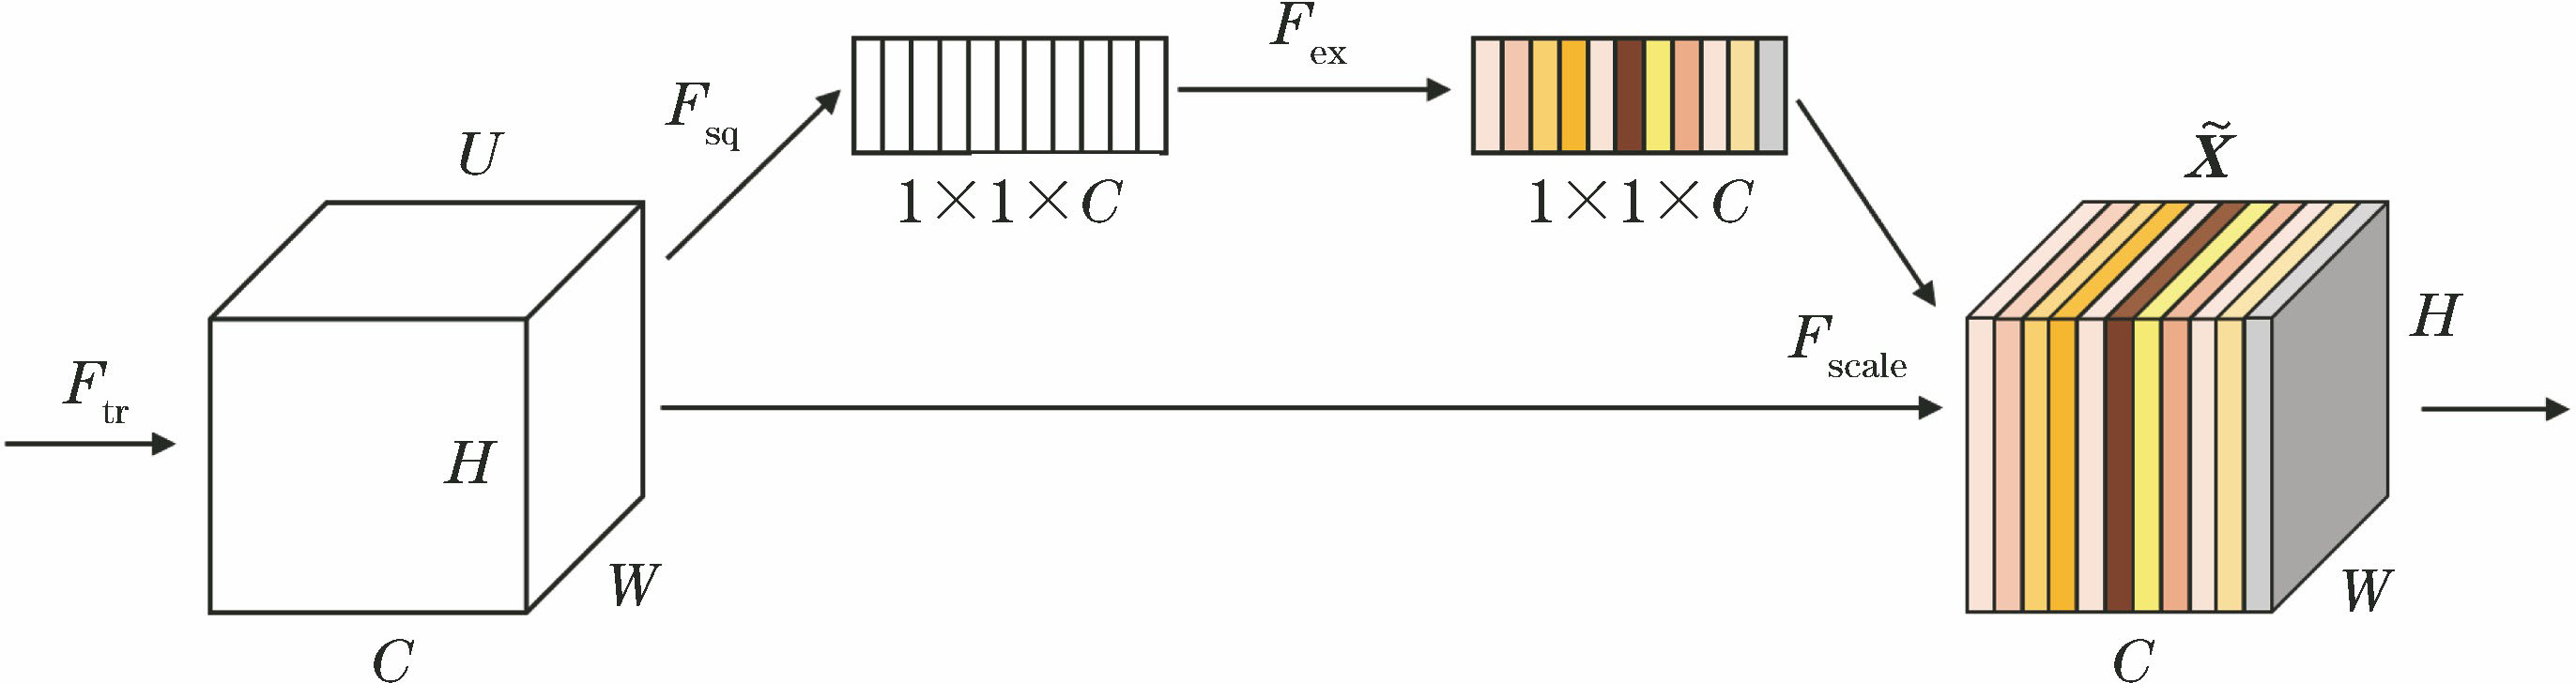
Fig. 2. Channel attention module
Fig. 3. Partial training set (first line) and test set (second line) images in Massachusetts road data set
Fig. 4. Partial training set (first line) and test set (second line) images in Inria aerial image labeling data set
Fig. 5. Depth model segmentation results in Massachusetts road data set. (a) RGB images; (b) ground-truth images; (c) Unet segmentation results; (d) RSIS-MLCA segmentation results
Fig. 6. Training process curves in Massachusetts road data set. (a) xloss curve on training set; (b) RIOU curve on test set
Fig. 7. Depth model segmentation results in Inria aerial image labeling data set. (a) RGB images; (b) ground-truth images; (c) Unet segmentation results; (d) RSIS-MLCA segmentation results
Fig. 8. Training process curves in Inria aerial image labeling data set. (a) xloss curve on training set; (b) RIOU curve on test set
| ||||||||||||||||||||||||||||||||||||||||||||||||||||||||||||||||||||||||||||||||||||||||||||||||||||||||||||||||||||||||||||||||||||||||||||||||||||||||||||||||||||||||||||||
Table 1. Network parameters of RSIS-MLCA
| |||||||||||||||||||||||||||||||||||||||||||||||||||
Table 2. Evaluation results for each picture in Fig. 5 and test set%
| |||||||||||||||||||||||||||||||||||||||||||||||||||
Table 3. Evaluation results for each picture in Fig. 7 and test set%
|
Table 4. Comparison between existing results and RSIS-MLCA%
|
Table 5. Comparison between existing results and RSIS-MLCA in Inria aerial image labeling data set

Set citation alerts for the article
Please enter your email address
© Copyright 2018-2021 | Chinese Laser Press. All Rights Reserved 沪ICP备15018463号-20