• Acta Optica Sinica
  • Vol. 44, Issue 2, 0204001 (2024)
Zifeng Song, Qi Tang, Bo Yu, Yunqing Xiao, Pinyang Liu, Tao Yi, and Feng Wang*
Author Affiliations
  • Laser Fusion Research Center, China Academy of Engineering Physics, Mianyang 621900, Sichuan , China
  • show less
    DOI: 10.3788/AOS231324 Cite this Article Set citation alerts
    Zifeng Song, Qi Tang, Bo Yu, Yunqing Xiao, Pinyang Liu, Tao Yi, Feng Wang. Simulation of Gamma Cherenkov Detector by Geant4 on 100 kJ Level Laser Facility[J]. Acta Optica Sinica, 2024, 44(2): 0204001 Copy Citation Text show less
    Schematic of GCD structure and physical process
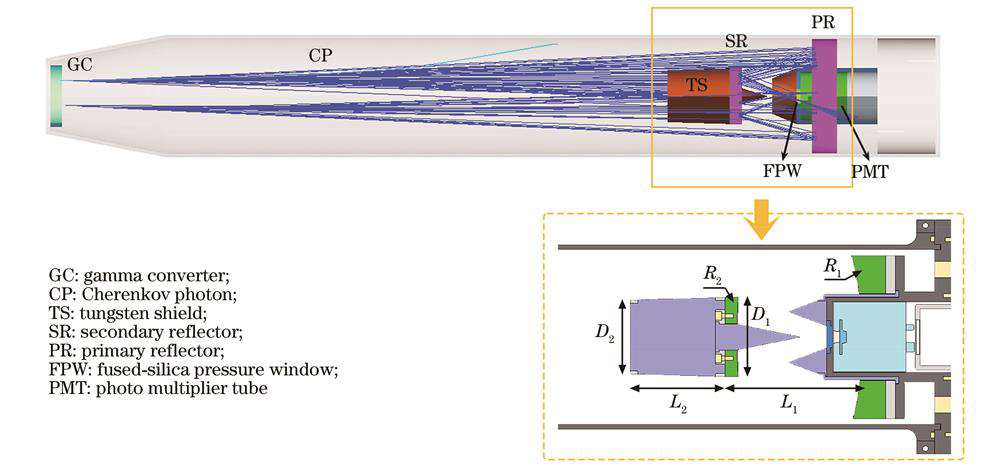
    Fig. 1. Schematic of GCD structure and physical process
    Schematic of GCD measurement signal timing
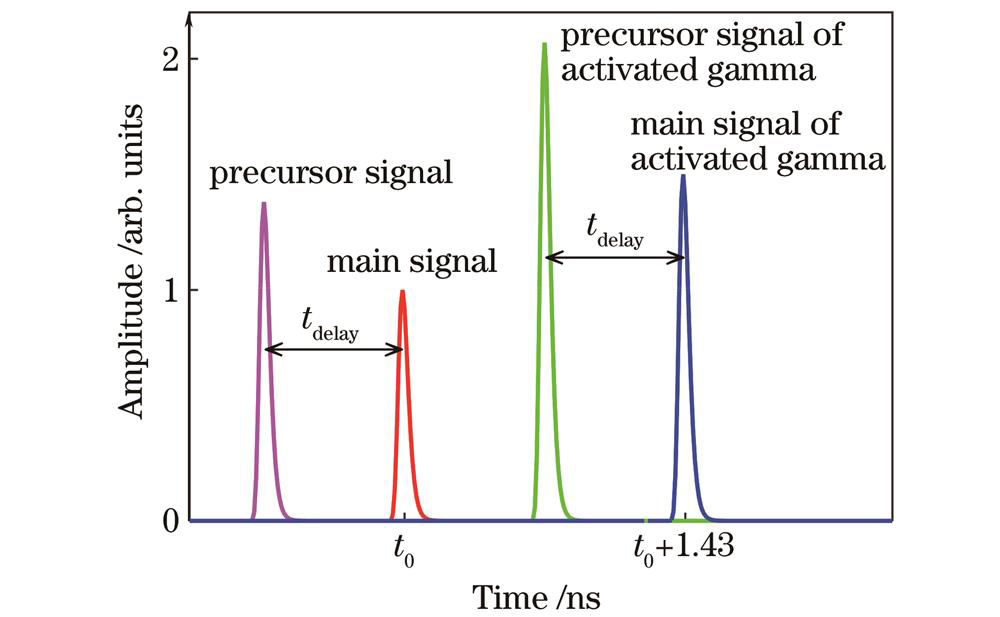
    Fig. 2. Schematic of GCD measurement signal timing
    Simulated electron conversion efficiency for various convertor materials
    Fig. 3. Simulated electron conversion efficiency for various convertor materials
    Simulated electron conversion efficiency for different thickness of C convertor
    Fig. 4. Simulated electron conversion efficiency for different thickness of C convertor
    Dependence of collected Cherenkov photon amount arrived at the end of gas cell on the gas length and gas diameter at a 6 MeV threshold energy. (a) Gas length; (b) gas diameter
    Fig. 5. Dependence of collected Cherenkov photon amount arrived at the end of gas cell on the gas length and gas diameter at a 6 MeV threshold energy. (a) Gas length; (b) gas diameter
    Simulation radial X/Y distribution of Cherenkov photons at different Z-positions along the axial direction of gas cell. (a) Z=5 cm; (b) Z=30 cm; (c) Z=55 cm; (d) Z=80 cm
    Fig. 6. Simulation radial X/Y distribution of Cherenkov photons at different Z-positions along the axial direction of gas cell. (a) Z=5 cm; (b) Z=30 cm; (c) Z=55 cm; (d) Z=80 cm
    Normalized angular distribution of Cherenkov photons in each statistic unit along the axial direction of gas cell
    Fig. 7. Normalized angular distribution of Cherenkov photons in each statistic unit along the axial direction of gas cell
    Normalized collection photon amount Nph and signal frontier ratio χ as functions of secondary mirror curvature R2 under different primary mirror curvature R1
    Fig. 8. Normalized collection photon amount Nph and signal frontier ratio χ as functions of secondary mirror curvature R2 under different primary mirror curvature R1
    Comparison of collecting photon waveforms under two optimized parameters
    Fig. 9. Comparison of collecting photon waveforms under two optimized parameters
    Simulation radial distribution of Cherenkov photons at the position of secondary mirror before and after reflection by primary mirror. (a) Before reflection by primary mirror; (b) after reflection by primary mirror
    Fig. 10. Simulation radial distribution of Cherenkov photons at the position of secondary mirror before and after reflection by primary mirror. (a) Before reflection by primary mirror; (b) after reflection by primary mirror
    Time interval tdelay between precursor signal and main signal,and normalized collection photon amount Nph as functions of the distance L1 between secondary mirror and primary mirror
    Fig. 11. Time interval tdelay between precursor signal and main signal,and normalized collection photon amount Nph as functions of the distance L1 between secondary mirror and primary mirror
    Simulation results of collecting photon time waveforms before and after adding tungsten shield
    Fig. 12. Simulation results of collecting photon time waveforms before and after adding tungsten shield
    Simulated angular distribution of collected Cherenkov photons
    Fig. 13. Simulated angular distribution of collected Cherenkov photons
    Simulated measurement signal by forward calculation method when electron threshold energy Eth is 6 MeV, neutron yield Yn is 1013,and photo multiplier tube gain M is 5×10³
    Fig. 14. Simulated measurement signal by forward calculation method when electron threshold energy Eth is 6 MeV, neutron yield Yn is 1013,and photo multiplier tube gain M is 5×10³
    Dependence of detector sensitivity Sic and electron threshold energy Eth on CO2 pressure
    Fig. 15. Dependence of detector sensitivity Sic and electron threshold energy Eth on CO2 pressure
    Dependence of detector sensitivity Sic and system efficiency Sef on installation distance
    Fig. 16. Dependence of detector sensitivity Sic and system efficiency Sef on installation distance
    Zifeng Song, Qi Tang, Bo Yu, Yunqing Xiao, Pinyang Liu, Tao Yi, Feng Wang. Simulation of Gamma Cherenkov Detector by Geant4 on 100 kJ Level Laser Facility[J]. Acta Optica Sinica, 2024, 44(2): 0204001
    Download Citation