
Zetao Jiang, Yuting He. Infrared and Visible Image Fusion Method Based on Convolutional Auto-Encoder and Residual Block[J]. Acta Optica Sinica, 2019, 39(10): 1015001
- Acta Optica Sinica
- Vol. 39, Issue 10, 1015001 (2019)
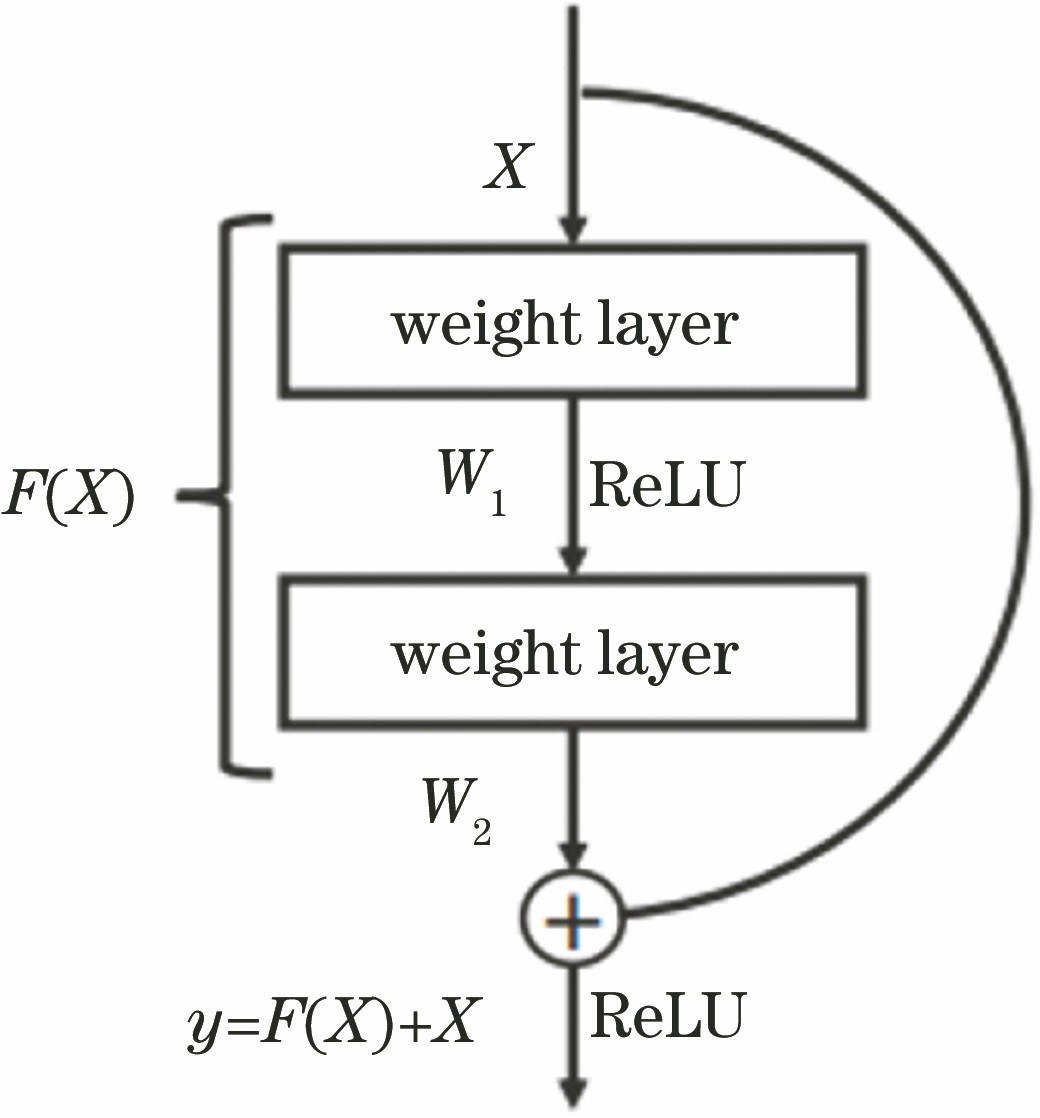
Fig. 1. Architecture of residual block
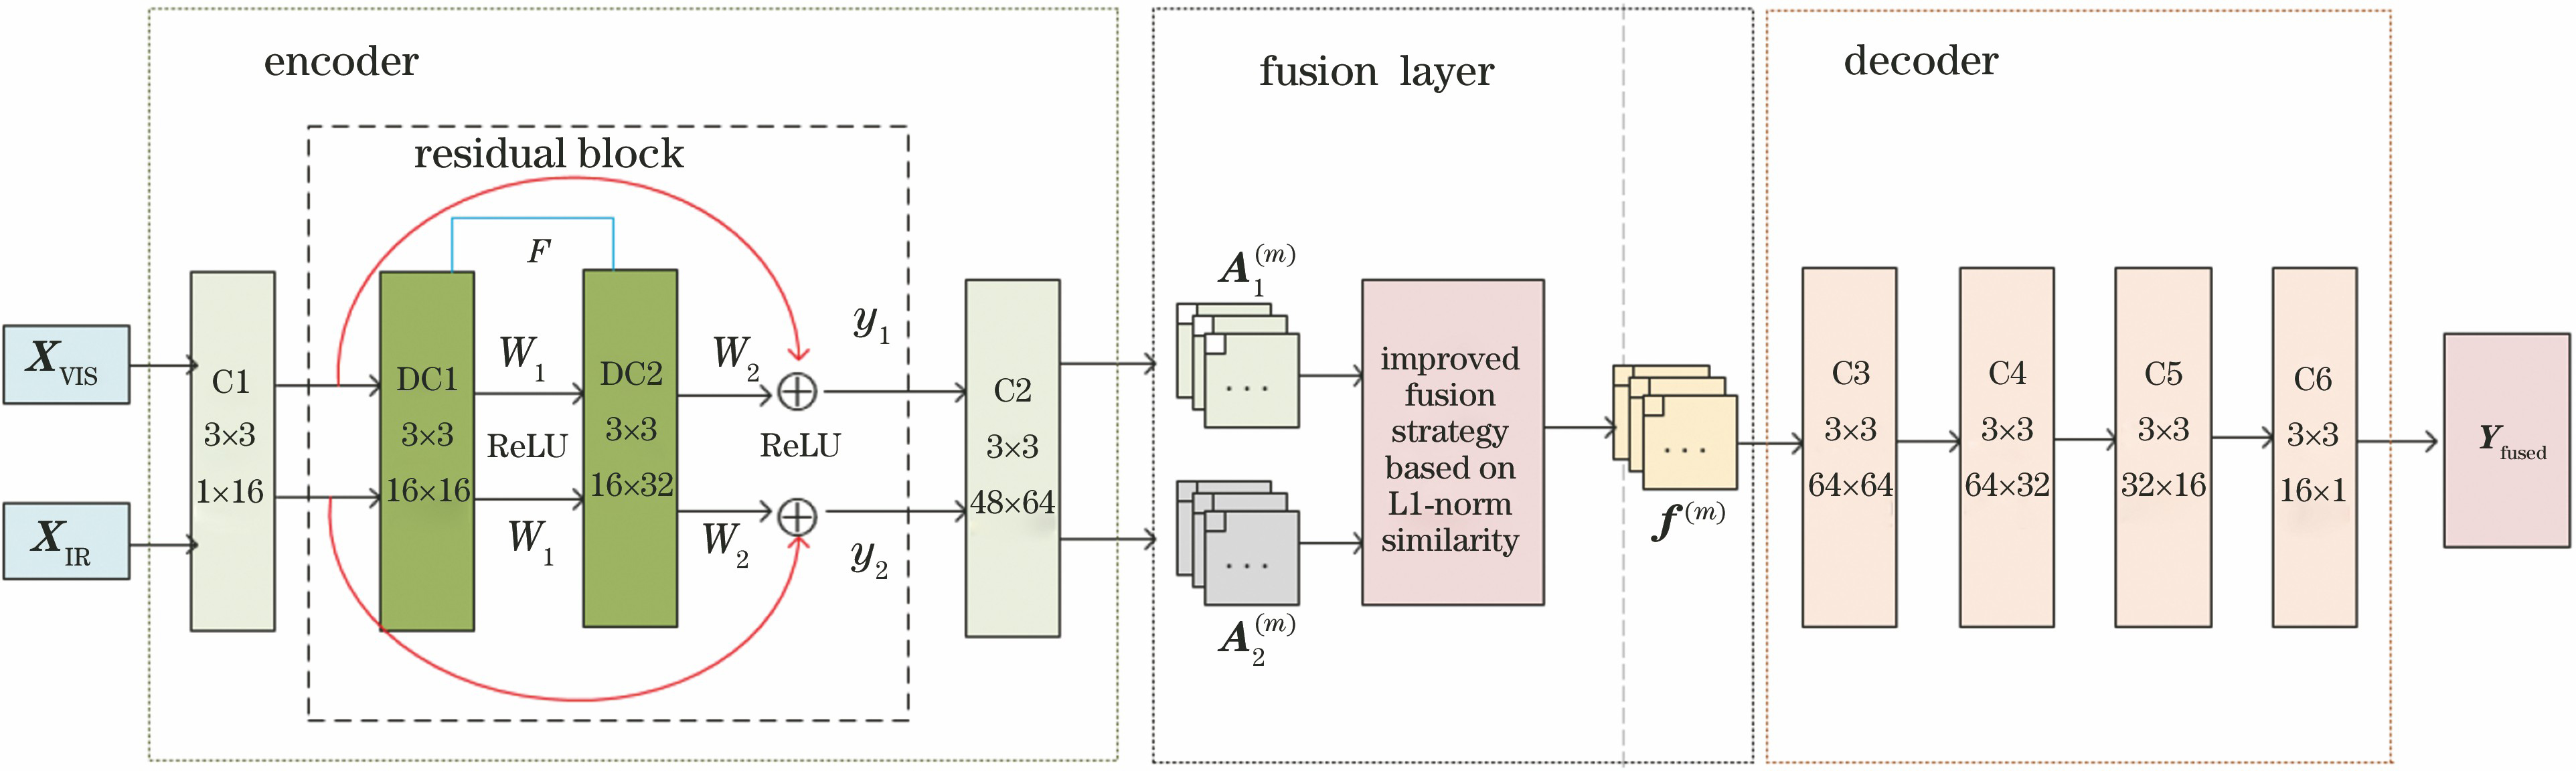
Fig. 2. Network architecture of proposed method
Fig. 3. Diagram of fusion strategy
Fig. 4. Decline curves of different loss functions in training process
Fig. 5. Framework of training process
Fig. 6. The first group of image fusion contrast experiments. (a) Infrared image; (b) visible image; (c) method in Ref. [15]; (d) method in Ref. [16]; (e) method in Ref. [17]; (f) method in Ref. [18]; (g) proposed method
Fig. 7. The second group of image fusion contrast experiments. (a) Infrared image; (b) visible image; (c) method in Ref. [15]; (d) method in Ref. [16]; (e) method in Ref. [17]; (f) method in Ref. [18]; (g) proposed method
Fig. 8. The third group of image fusion contrast experiments. (a) Infrared image; (b) visible image; (c) method in Ref. [15]; (d) method in Ref. [16]; (e) method in Ref. [17]; (f) method in Ref. [18]; (g) proposed method
Fig. 9. Partial results of image fusion contrast experiments. (a1)-(a6) Infrared images; (b1)-(b6) visible images; (c1)-(c6) method in Ref. [15]; (d1)-(d6) method in Ref. [16]; (e1)-(e6) method in Ref. [17]; (f1)-(f6) method in Ref. [18]; (g1)-(g6) proposed method
|
Table 1. Objective evaluation indicators of the first group of comparative experimental results
|
Table 2. Objective evaluation indicators of the second group of comparative experimental results
|
Table 3. Objective evaluation indicators of the third group of comparative experimental results

Set citation alerts for the article
Please enter your email address
© Copyright 2018-2021 | Chinese Laser Press. All Rights Reserved 沪ICP备15018463号-20