• Laser & Optoelectronics Progress
  • Vol. 58, Issue 22, 2201001 (2021)
Jingjing Zhu1, Jingwei Zhang2, Ying Mao3、4, and Zhongfeng Qiu2、*
Author Affiliations
  • 1School of Electronic & Information Engineering, Nanjing University of Information Science and Technology, Nanjing, Jiangsu 210044, China;
  • 2School of Marine Science, Nanjing University of Information Science and Technology, Nanjing, Jiangsu 210044, China
  • 3Fujian Provincial Meteorological Disaster Prevention Technology Center, Fuzhou, Fujian 350001, China
  • 4Fujian Key Laboratory of Severe Weather, Fuzhou, Fujian 350001, China
  • show less
    DOI: 10.3788/LOP202158.2201001 Cite this Article Set citation alerts
    Jingjing Zhu, Jingwei Zhang, Ying Mao, Zhongfeng Qiu. Temporal and Spatial Distribution of Suspended Particles in Qingcaosha Reservoir of the Yangtze River Estuary Based on Landsat-8 OLI[J]. Laser & Optoelectronics Progress, 2021, 58(22): 2201001 Copy Citation Text show less
    True color image of Qingcaosha reservoir (composite from L8/OLI bands 4, 3, and 2) acquired on 12 February, 2017 by the Landsat-8 (row 118, path 38)
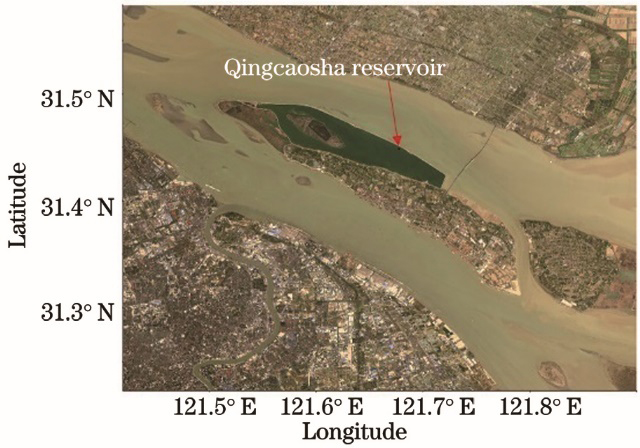
    Fig. 1. True color image of Qingcaosha reservoir (composite from L8/OLI bands 4, 3, and 2) acquired on 12 February, 2017 by the Landsat-8 (row 118, path 38)
    Scatter plot of the measured and estimated SPM concentration (The black line is the 1∶1 line. The L8 images were acquired on 22 September, 2016 and 4 March, 2018). (a) SPM concentration measured in situ versus SPM estimated from the calibrated mode; (b) scatter plots of comparisons between L8/OLI measured SPM concentration in-situ and estimated concentration made within 24 h time window
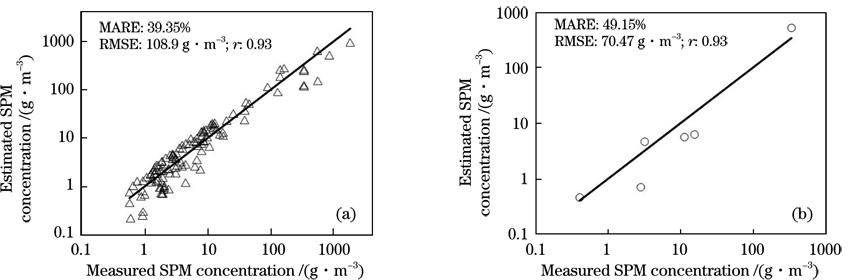
    Fig. 2. Scatter plot of the measured and estimated SPM concentration (The black line is the 1∶1 line. The L8 images were acquired on 22 September, 2016 and 4 March, 2018). (a) SPM concentration measured in situ versus SPM estimated from the calibrated mode; (b) scatter plots of comparisons between L8/OLI measured SPM concentration in-situ and estimated concentration made within 24 h time window
    Average distribution of SPM concentration derived from 2013 to 2019. (a) Average distribution of SPM concentration obtained based on the L8/OLI inversion, in which three sections (labeled L, M and N) are used to analyze the SPM concentration distribution at different locations, L, M, and N represent the upper part, the middle part and the lower part, respectively, and the position of the inlet gate of the reservoir is marked as A; (b) corresponding standard deviation
    Fig. 3. Average distribution of SPM concentration derived from 2013 to 2019. (a) Average distribution of SPM concentration obtained based on the L8/OLI inversion, in which three sections (labeled L, M and N) are used to analyze the SPM concentration distribution at different locations, L, M, and N represent the upper part, the middle part and the lower part, respectively, and the position of the inlet gate of the reservoir is marked as A; (b) corresponding standard deviation
    Spatial distributions of SPM concentration derived from 2013 to 2019 L8/OLI measurements. (a) Spatial distributions of maximum; (b) spatial distributions of minimum
    Fig. 4. Spatial distributions of SPM concentration derived from 2013 to 2019 L8/OLI measurements. (a) Spatial distributions of maximum; (b) spatial distributions of minimum
    Comparison between mean SPM concentrations and standard deviation (STD) along the three sections, where mean SPM concentration and STD are derived from 2013 to 2019 L8/OLI measurements, and the grey areas represent the latitude ranges of the Qingcaosha reservoir
    Fig. 5. Comparison between mean SPM concentrations and standard deviation (STD) along the three sections, where mean SPM concentration and STD are derived from 2013 to 2019 L8/OLI measurements, and the grey areas represent the latitude ranges of the Qingcaosha reservoir
    Spatial distributions of SPM concentration derived from L8/OLI measurements. (a) January 23, 2015; (b) March 12, 2015; (c) August 24, 2016; (d) October 30, 2018
    Fig. 6. Spatial distributions of SPM concentration derived from L8/OLI measurements. (a) January 23, 2015; (b) March 12, 2015; (c) August 24, 2016; (d) October 30, 2018
    SPM distribution at L, M and N sections, where different lines represent inversion values of L8/OLI SPM concentration at different time and the grey areas represent the latitude ranges of the Qingcaosha reservoir
    Fig. 7. SPM distribution at L, M and N sections, where different lines represent inversion values of L8/OLI SPM concentration at different time and the grey areas represent the latitude ranges of the Qingcaosha reservoir
    Comparison of SPM concentration in three sections based on 20 scenes L8/OLI estimation (the gray area represents the latitude range of Qingcaosha reservoir; from top to bottom, the sections are L, M and N, respectively)
    Fig. 8. Comparison of SPM concentration in three sections based on 20 scenes L8/OLI estimation (the gray area represents the latitude range of Qingcaosha reservoir; from top to bottom, the sections are L, M and N, respectively)
    No.TimeNo.Time
    12014-12-22112017-04-02
    22015-01-07122017-04-18
    32015-01-23132017-07-23
    42015-03-12142017-08-24
    52016-01-26152018-01-15
    62016-02-27162018-05-23
    72016-04-15172018-07-26
    82016-06-02182018-10-30
    92016-07-20192018-12-17
    102017-02-13202019-01-18
    Table 1. 20 remote sensing image information
    BandWavelength /μmResolution /mCenter wavelength /μm
    Band 1, Coastal0.433--0.453300.443
    Band 2, Blue0.450--0.515300.483
    Band 3, Green0.525--0.600300.561
    Band 4, Red0.630--0.680300.655
    Band 5, NIR0.845--0.885300.865
    Band 6, SWIR11.560--1.651301.609
    Band 7, SWIR22.100--2.300302.201
    Band 8, Pan0.500--0.680150.59
    Band 9, Cirrus1.360--1.390301.373
    Table 2. Band setting information of L8/OLI
    WaterSPM concentration and Percentage of effective pixelsMeanMaximumMinimum
    Changjiang riverSPM concentration /( g·m-3)103.711855.481.94
    Percentage of effective pixels for concentration <15 g·m-3 /%1.980.355.46
    Percentage of effective pixels for concentration 15--35 g·m-3 /%4.325.9211.77
    Percentage of effective pixels for concentration 35--100 g·m-3 /%43.154.5381.35
    Percentage of effective pixels for concentration >100 g·m-3 /%50.5589.201.42
    Qingcaosha reservoirSPM concentration /( g·m-3)22.00545.013.82
    Percentage of effective pixels for concentration <15 g·m-3 /%32.6093.77
    Percentage of effective pixels for concentration 15--35 g·m-3 /%56.3661.996.14
    Percentage of effective pixels for concentration 35--100 g·m-3 /%10.4833.190.08
    Percentage of effective pixels for concentration >100 g·m-3 /%0.474.820.01
    Table 3. Statistics characteristics of the SPM concentration derived from the L8/OLI data in the Changjiang River estuary and the Qingcaosha reservoir
    Jingjing Zhu, Jingwei Zhang, Ying Mao, Zhongfeng Qiu. Temporal and Spatial Distribution of Suspended Particles in Qingcaosha Reservoir of the Yangtze River Estuary Based on Landsat-8 OLI[J]. Laser & Optoelectronics Progress, 2021, 58(22): 2201001
    Download Citation