• Spectroscopy and Spectral Analysis
  • Vol. 42, Issue 4, 1049 (2022)
Ya-xiong HE1、*, Wen-qi ZHOU1、1; 2;, Bin ZHUANG1、1; 2;, Yong-sheng ZHANG1、1; 2;, Chuan KE3、3;, Tao XU1、1; 2; *;, and Yong ZHAO1、1; 2; 3;
Author Affiliations
  • 11. Fujian Provincial Collaborative Innovation Center for Advanced High-Field Superconducting Materials and Engineering, Fuzhou 350117, China
  • 33. Center for Superconducting and New Energy Research and Development, Southwest Jiaotong University, Chengdu 610031, China
  • show less
    DOI: 10.3964/j.issn.1000-0593(2022)04-1049-09 Cite this Article
    Ya-xiong HE, Wen-qi ZHOU, Bin ZHUANG, Yong-sheng ZHANG, Chuan KE, Tao XU, Yong ZHAO. Study on Time-Resolved Characteristics of Laser-Induced Argon Plasma[J]. Spectroscopy and Spectral Analysis, 2022, 42(4): 1049 Copy Citation Text show less
    Experimental setup diagram of laser-induced breakdown in argon
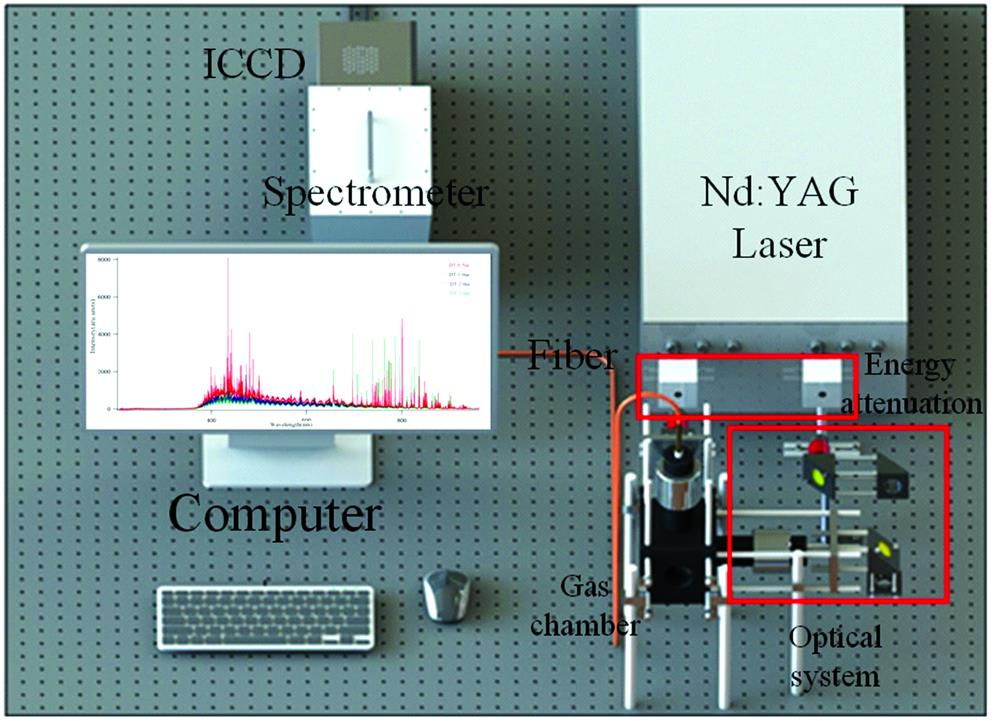
    Fig. 1. Experimental setup diagram of laser-induced breakdown in argon
    Spectral evolution characteristics of Ar plasma under different delay times
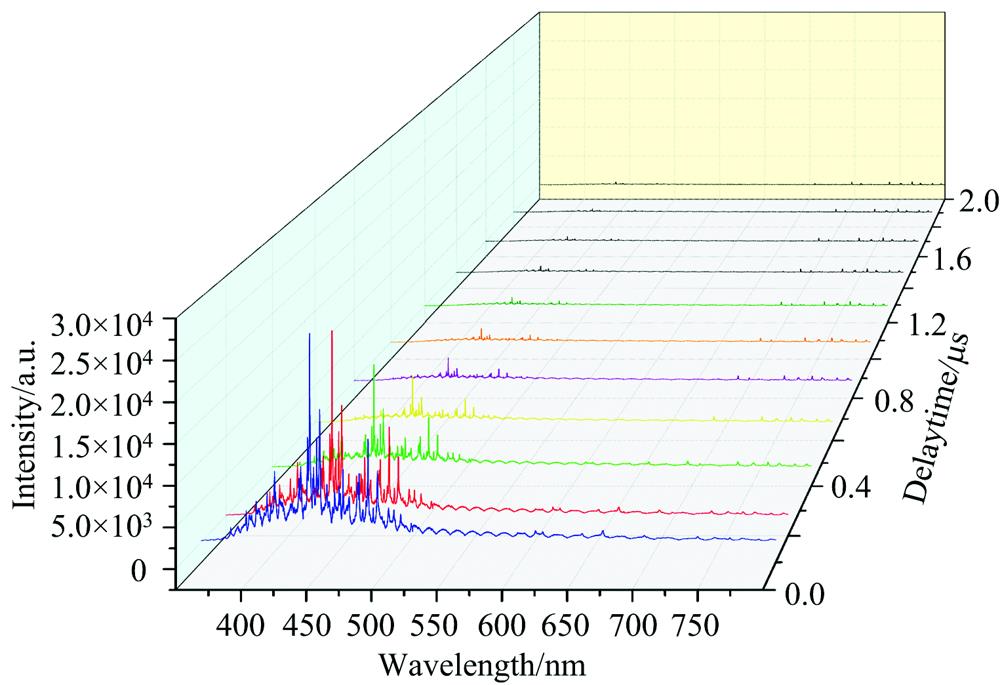
    Fig. 2. Spectral evolution characteristics of Ar plasma under different delay times
    Time evolutions of Ar characteristic spectral lines under three laser pulse energies
    Fig. 3. Time evolutions of Ar characteristic spectral lines under three laser pulse energies
    Fitting curve of Ar 696.54 nm spectral line
    Fig. 4. Fitting curve of Ar 696.54 nm spectral line
    The laser-induced electron density of Argon plasma at different laser energies (60, 80 and 100 mJ) calculated by stark broadening of the Ar Ⅰ 696.54 nm lines. The error bar is calculated according to the fitting error of the Stark stretch parameter
    Fig. 5. The laser-induced electron density of Argon plasma at different laser energies (60, 80 and 100 mJ) calculated by stark broadening of the Ar Ⅰ 696.54 nm lines. The error bar is calculated according to the fitting error of the Stark stretch parameter
    Saha-Boltzmann diagrams of different delay times under different laser energies
    Fig. 6. Saha-Boltzmann diagrams of different delay times under different laser energies
    Plasma temperature at various delay times for different laser energies
    Fig. 7. Plasma temperature at various delay times for different laser energies
    Time evolution of signal-to-noise ratio of Ar spectrum under different laser energies
    Fig. 8. Time evolution of signal-to-noise ratio of Ar spectrum under different laser energies
    SpeciesWavelength
    /nm
    Aji
    /s-1
    gjEi
    /eV
    Ej
    /eV
    Ar Ⅰ696.546.40×106311.548 413.327 9
    Ar Ⅰ738.398.50×106511.623 613.302 2
    Ar Ⅰ763.512.45×107511.548 413.171 8
    Ar Ⅰ772.421.17×107311.723 213.327 9
    Ar Ⅱ434.811.17×108816.643 919.494 5
    Ar Ⅱ460.957.89×107818.454 121.143 1
    Ar Ⅱ480.607.80×107616.643 919.222 9
    Ar Ⅱ487.998.23×107617.140 019.680 0
    Table 1. Relevant spectral data of the observed emission lines
    Ya-xiong HE, Wen-qi ZHOU, Bin ZHUANG, Yong-sheng ZHANG, Chuan KE, Tao XU, Yong ZHAO. Study on Time-Resolved Characteristics of Laser-Induced Argon Plasma[J]. Spectroscopy and Spectral Analysis, 2022, 42(4): 1049
    Download Citation