• Acta Optica Sinica
  • Vol. 38, Issue 11, 1115007 (2018)
Li Yan*, Rui Wang*, Hua Liu, and Changjun Chen
Author Affiliations
  • School of Geodesy and Geomatics, Wuhan University, Wuhan, Hubei 430079, China
  • show less
    DOI: 10.3788/AOS201838.1115007 Cite this Article Set citation alerts
    Li Yan, Rui Wang, Hua Liu, Changjun Chen. Stereo Matching Method Based on Improved Cost Computation and Adaptive Guided Filter[J]. Acta Optica Sinica, 2018, 38(11): 1115007 Copy Citation Text show less
    Diagram of proposed method
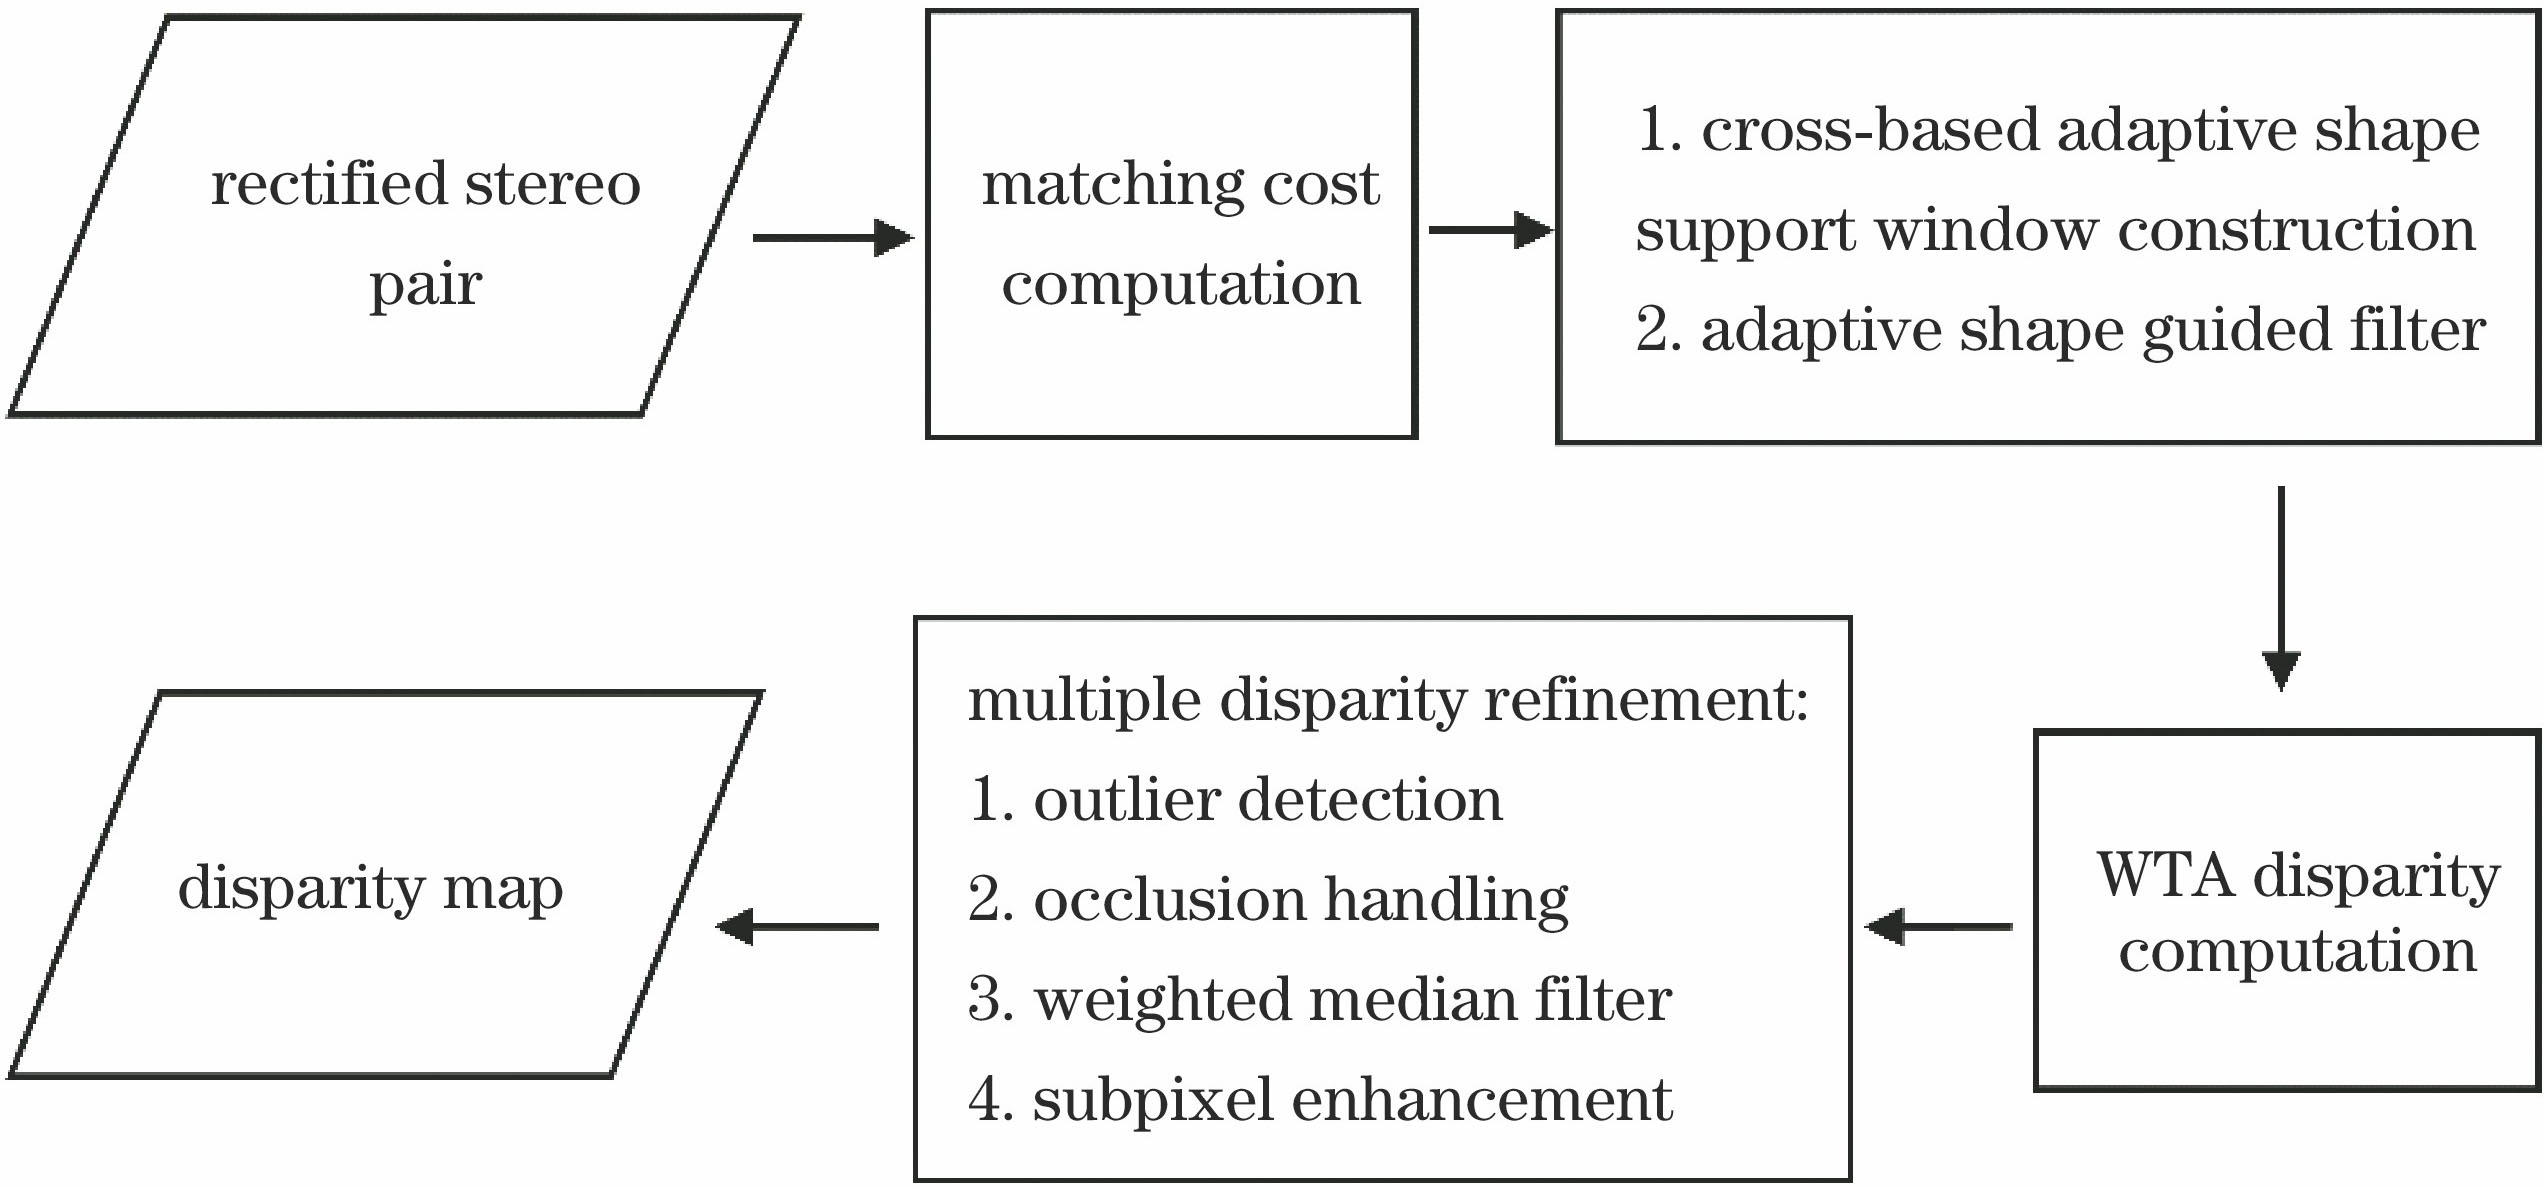
    Fig. 1. Diagram of proposed method
    Initial disparity maps based on different cost methods for Tsukuba. (a) Absolute difference in images gradients; (b) absolute difference in enhanced images gradients; (c) traditional Census transform; (d) Census transformation based on enhanced images gradients
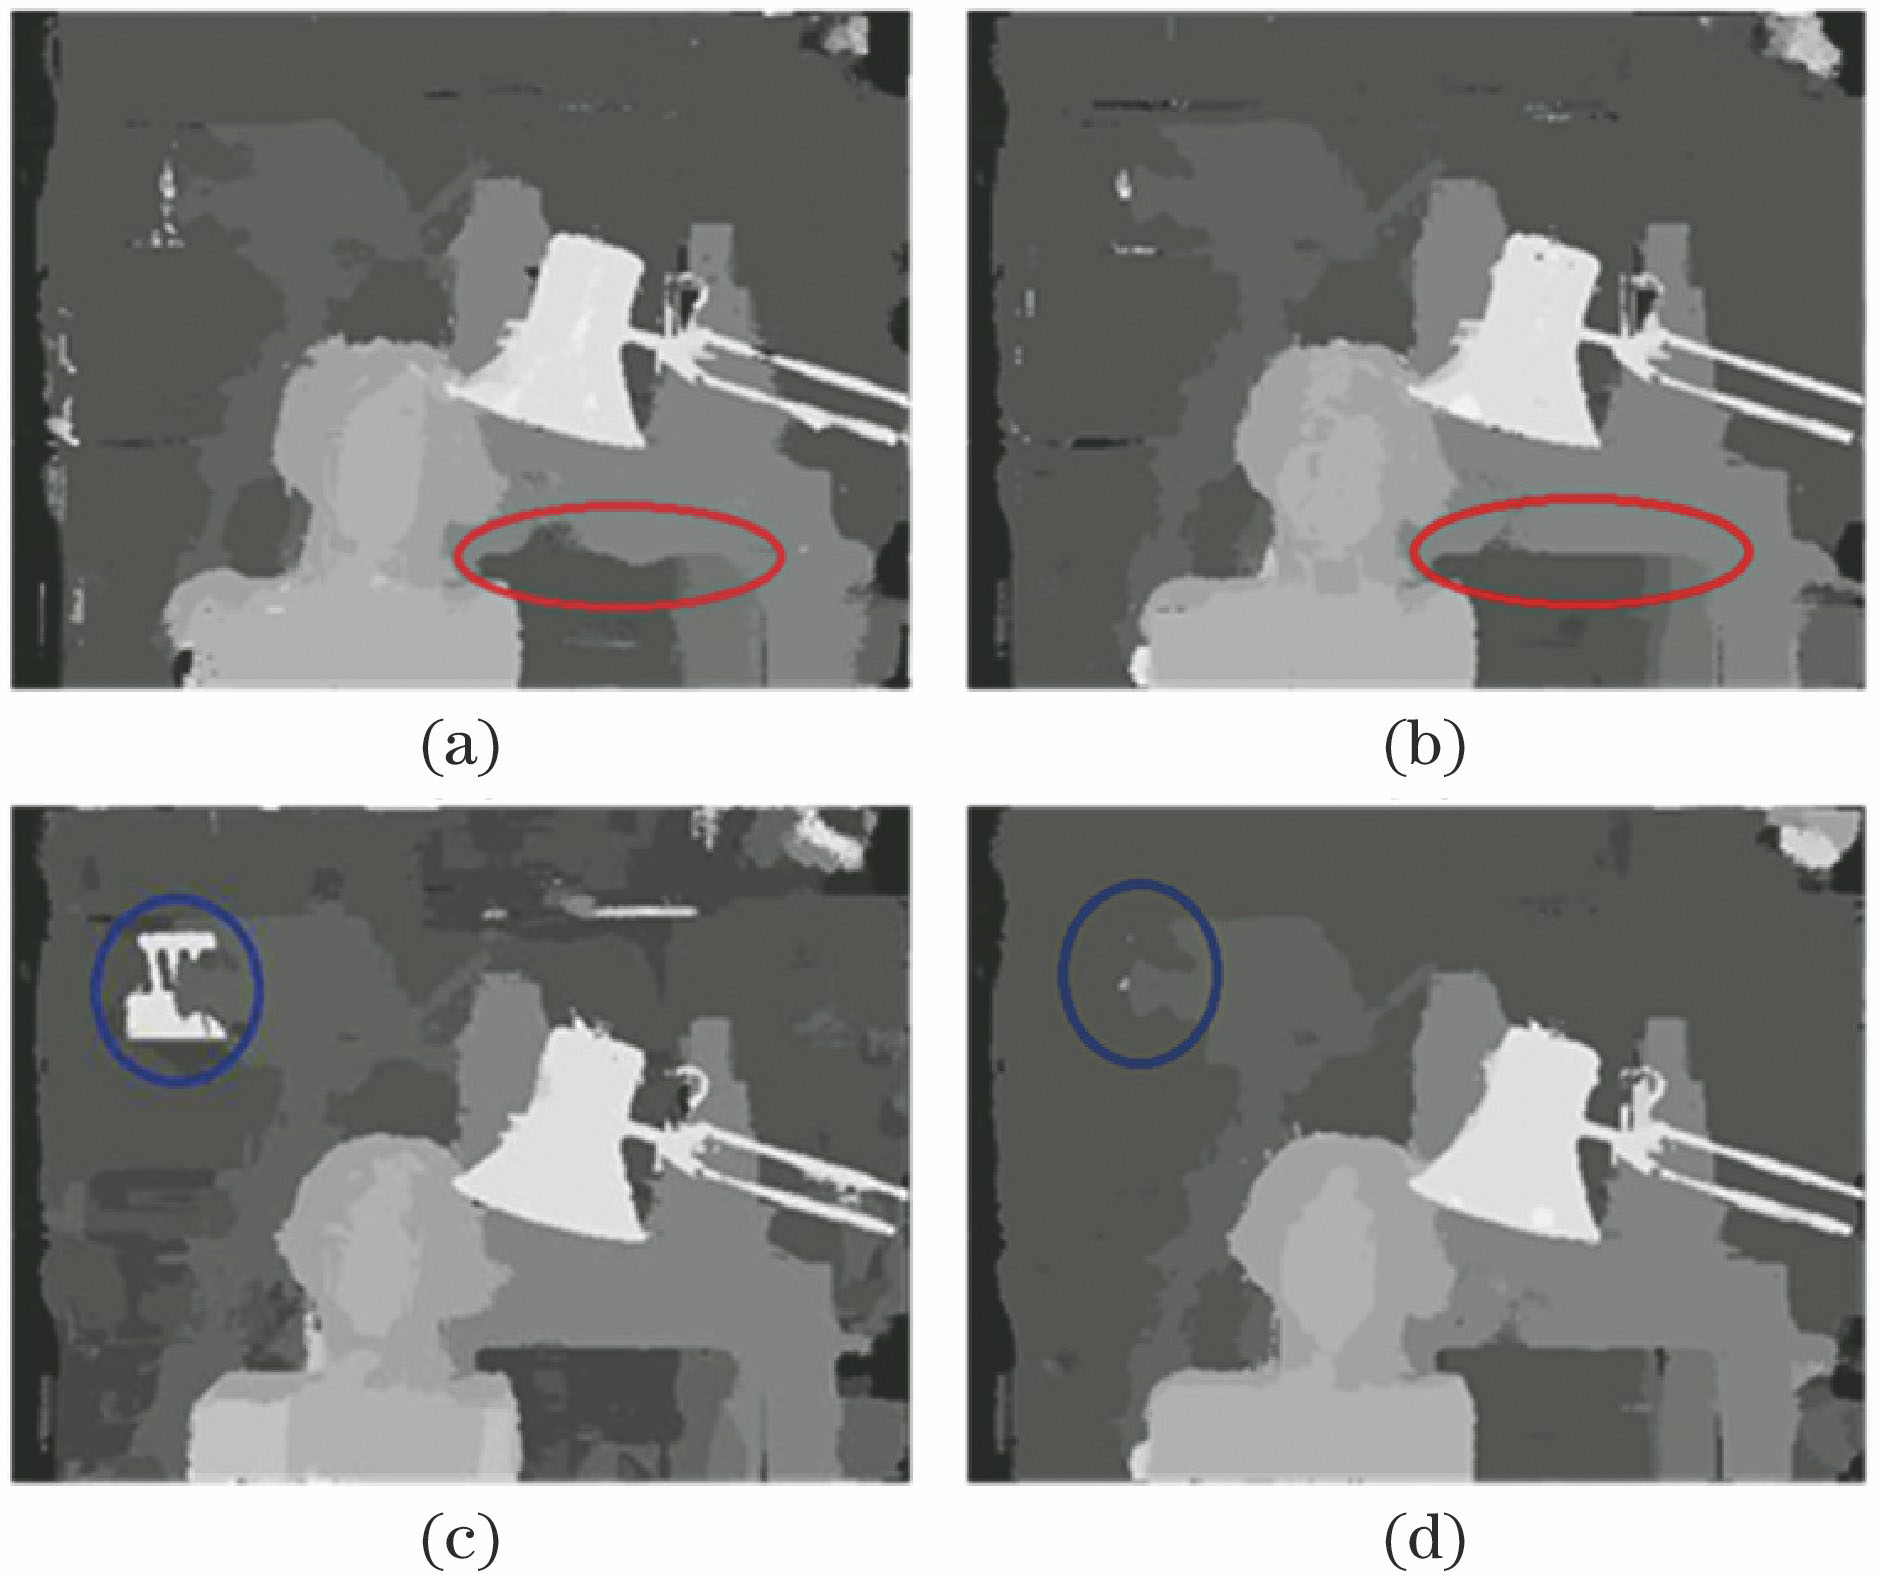
    Fig. 2. Initial disparity maps based on different cost methods for Tsukuba. (a) Absolute difference in images gradients; (b) absolute difference in enhanced images gradients; (c) traditional Census transform; (d) Census transformation based on enhanced images gradients
    Schematic of adaptive window construction. (a) Cross-based support region construction; (b) adaptive window in Ref. [17]; (c) adaptive window in Ref. [14]; (d) adaptive window in proposed method
    Fig. 3. Schematic of adaptive window construction. (a) Cross-based support region construction; (b) adaptive window in Ref. [17]; (c) adaptive window in Ref. [14]; (d) adaptive window in proposed method
    Disparity maps under different illumination conditions for Aloe and Baby1. (a) Left image; (b) right image; (c) ground truth; (d) SAD+Grad; (e) AD+Cen; (f) AD+Grad+Cen; (g) proposed cost computation
    Fig. 4. Disparity maps under different illumination conditions for Aloe and Baby1. (a) Left image; (b) right image; (c) ground truth; (d) SAD+Grad; (e) AD+Cen; (f) AD+Grad+Cen; (g) proposed cost computation
    Disparity maps with different exposures for Aloe and Baby1. (a) Left image; (b) right image; (c) ground truth; (d) SAD+Grad; (e) AD+Cen; (f) AD+Grad+Cen; (g) proposed cost computation
    Fig. 5. Disparity maps with different exposures for Aloe and Baby1. (a) Left image; (b) right image; (c) ground truth; (d) SAD+Grad; (e) AD+Cen; (f) AD+Grad+Cen; (g) proposed cost computation
    Disparity maps of different cost aggregation algorithms for textureless images. (a) Left images; (b) ground truth maps; (c) results of local stereo method based on guided filter; (d) error maps for method based on guided filter; (e) results of the proposed method; (f) error maps of the proposed method
    Fig. 6. Disparity maps of different cost aggregation algorithms for textureless images. (a) Left images; (b) ground truth maps; (c) results of local stereo method based on guided filter; (d) error maps for method based on guided filter; (e) results of the proposed method; (f) error maps of the proposed method
    Experimental results on different parameter settings
    Fig. 7. Experimental results on different parameter settings
    ParameterValueParameterValue
    λGRAD25λCTg15
    τ130L131
    τ26L280
    dLim9ε0.012
    Table 1. Experimental parameter settings
    AlgorithmAloeBaby1Bowling1Cloth1FlowerpotsRocks1Avg
    SAD+Grad32.17516.88240.90010.82953.52827.23830.259
    AD+Cen32.27425.05546.14713.21256.00018.73231.903
    AD+Grad+Cen37.14923.17546.65812.69072.10632.37537.359
    Proposed22.03411.11526.94611.33334.18513.84919.910
    Table 2. Error matching rates of various cost computations under different illuminations%
    AlgorithmAloeBaby1Bowling1Cloth1FlowerpotsRocks1Avg
    SAD+Grad52.51050.67246.43450.17887.56279.77361.188
    AD+Cen16.17311.11820.02211.09641.02115.32919.127
    AD+Grad+Cen31.01230.18231.37413.54377.59044.21837.987
    Proposed15.20510.65822.78211.06029.83414.09417.272
    Table 3. Error matching rates of various cost computations under different exposures%
    AlgorithmAloeBaby1Bowling1Cloth1FlowerpotsRocks1Avg
    SAD+Grad12.40912.00926.1229.61920.69710.59815.242
    AD+Cen13.61011.81123.85910.47522.67612.76615.866
    AD+Grad+Cen15.34912.35024.56311.23621.83212.58616.319
    Proposed14.4789.74918.66311.08518.64412.00814.104
    Table 4. Error matching rates of various cost computations without radiometric changes%
    AlgorithmTsukubaVenusTeddyConesAvg
    n-occalldiscn-occalldiscn-occalldiscn-occalldisc
    GF2.212.598.560.320.684.314.778.6213.12.537.907.675.27
    Proposed1.741.958.350.230.423.173.957.8810.82.808.118.254.80
    Table 5. Error matching rates of different algorithms for different images%
    AlgorithmAloeBaby1Baby2Baby3Bowling1Bowling2
    GF7.4072.5755.5345.9817.94012.184
    Proposed8.6264.09210.6356.19714.63614.794
    AlgorithmCloth1Cloth2Cloth3Cloth4FlowerpotsLampshade1
    GF2.9608.6133.9408.39312.40511.223
    Proposed3.22510.4184.3328.45412.6969.540
    AlgorithmLampshade2Midd1Midd2MonopolyPlasticRocks1
    GF15.72937.65335.38122.80332.6664.183
    Proposed8.57013.85716.2707.33525.7244.968
    AlgorithmRocks2Wood1Wood2Avg(all)
    GF3.5873.8290.96511.712
    Proposed3.9738.5740.4849.400
    Table 6. Error matching rates of different algorithms in all regions%
    AlgorithmLampshade1Lampshade2Midd1Midd2MonopolyPlasticAvg
    CostFilter23.24231.81148.99345.20036.79643.75838.300
    CS-GF10.7208.63429.12725.89214.43922.17818.498
    CS-MST14.95516.36018.29417.49630.62637.93322.610
    CS-ST13.20112.18816.0729.58724.05330.72417.638
    Proposed9.5408.57013.85716.2707.33525.72413.549
    Table 7. Error matching rates of different algorithms for textureless images%
    AlgorithmTsukubaVenusTeddyCones
    CostFilter1.182.466.416.47
    CS-GF2.765.1215.0715.55
    CS-MST2.142.595.885.98
    CS-ST1.952.515.575.61
    Proposed3.425.8514.46914.253
    Table 8. Runtime comparison of different algorithms for benchmark stereo imagess
    Li Yan, Rui Wang, Hua Liu, Changjun Chen. Stereo Matching Method Based on Improved Cost Computation and Adaptive Guided Filter[J]. Acta Optica Sinica, 2018, 38(11): 1115007
    Download Citation