
Ming Pang, Yixuan Fu. Effects of Scanning Speed on Microstructure and Performances of Laser Direct Metal Deposition Airport Oil Pipeline Network Materials[J]. Laser & Optoelectronics Progress, 2021, 58(7): 0714001
- Laser & Optoelectronics Progress
- Vol. 58, Issue 7, 0714001 (2021)
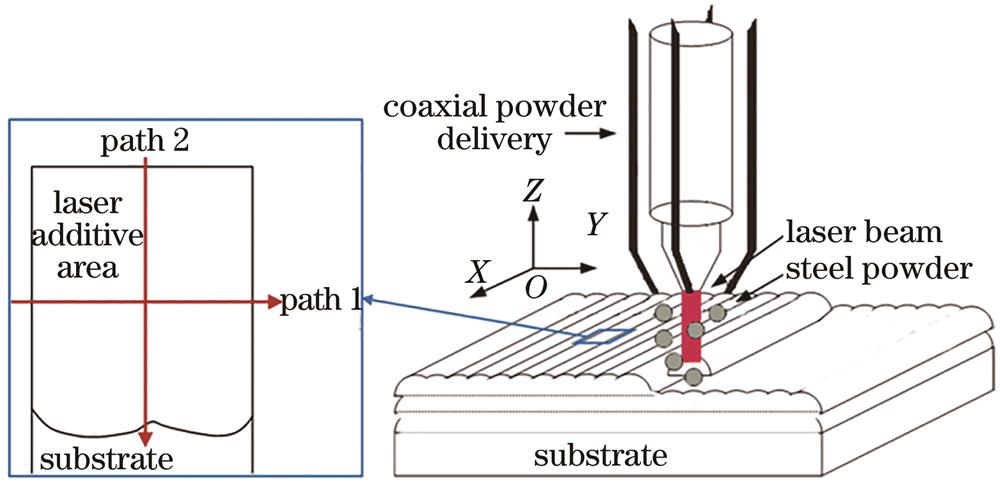
Fig. 1. Coaxial powder feeding laser direct metal deposition experiment and schematic of the hardness measurement paths
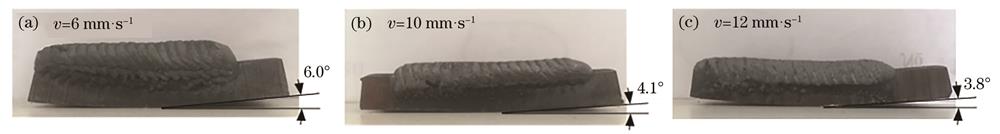
Fig. 2. Effect of laser scanning speed on macroscopic morphology of deposition layer
Fig. 3. Effect of laser scanning speed on microstructures at the different positions of the deposition layer
Fig. 4. Effect of laser scanning speed on section macroscopic morphologies of the deposition layer. (a) v=6 mm/s, cross section; (b) v=10 mm/s, cross section; (c) v=12 mm/s, cross section; (d) v=6 mm/s, longitudinal section; (e) v=10 mm/s, longitudinal section; (f) v=12 mm/s, longitudinal section
Fig. 5. Effect of laser scanning speed on impurities in deposition layer. (a) v=6 mm/s; (b) v=10 mm/s
Fig. 6. Effect of laser scanning speed on hardness of the deposition layer. (a) Path 1; (b) path 2
Fig. 7. Effect of laser scanning speed on corrosion resistance of deposition layer
Fig. 8. Effect of laser scanning speed on wear resistance of deposition layer
Fig. 9. Wear morphologies of deposition layer prepared at different laser scanning speeds. (a)v=6 mm/s; (b)v=10 mm/s; (c)v=12 mm/s
|
Table 1. Main chemical composition of powder for coaxial feeding
|
Table 2. Effect of laser scanning speed on deposition layer thickness

Set citation alerts for the article
Please enter your email address
© Copyright 2018-2021 | Chinese Laser Press. All Rights Reserved 沪ICP备15018463号-20