
Ke Zhang, Liang Zhang. Multi-Scale Detection for X-Ray Prohibited Items in Complex Background[J]. Laser & Optoelectronics Progress, 2021, 58(22): 2210002
- Laser & Optoelectronics Progress
- Vol. 58, Issue 22, 2210002 (2021)
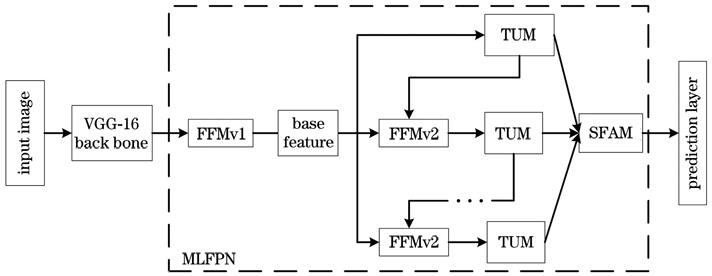
Fig. 1. Framework of M2Det
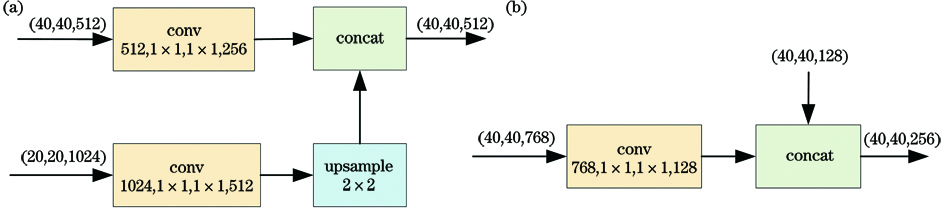
Fig. 2. Structure of different modules in FFM. (a)FFMv1; (b)FFMv2
Fig. 3. Structure of different models. (a) FPN; (b) RFP
Fig. 4. Structure of different modules. (a) CAM; (b) SAM
Fig. 5. EM2Det model
Fig. 6. Structure of feature fusion enhancement module
Fig. 7. Detail of feature fusion enhancement module
Fig. 8. Details of recursive modules for U-shaped network
Fig. 9. Residual side attention module
Fig. 10. Some images in SIXray OD dataset. (a) Gun; (b) wrench; (c) knife; (d) pliers; (e) scissors
Fig. 11. Visualizations in different situations. (a) Scissors; (b) pliers; (c) gun; (d) wrench; (e) knife
|
Table 1. Index under different number of TUMs
|
Table 2. Experiment effect of feature fusion enhancement module
|
Table 3. Experimental effects of U-shaped network recursive module and residual edge attention module
| |||||||||||||||||||||||||||||||||||||||||||||||||||||||||||||
Table 4. Accuracy of different detection models


Set citation alerts for the article
Please enter your email address

© Copyright 2018-2021 | Chinese Laser Press. All Rights Reserved 沪ICP备15018463号-20