
Christian Lafforgue, Miguel Montesinos-Ballester, Thi-Thuy-Duong Dinh, Xavier Le Roux, Eric Cassan, Delphine Marris-Morini, Carlos Alonso-Ramos, Laurent Vivien. Supercontinuum generation in silicon photonics platforms[J]. Photonics Research, 2022, 10(3): A43
- Photonics Research
- Vol. 10, Issue 3, A43 (2022)
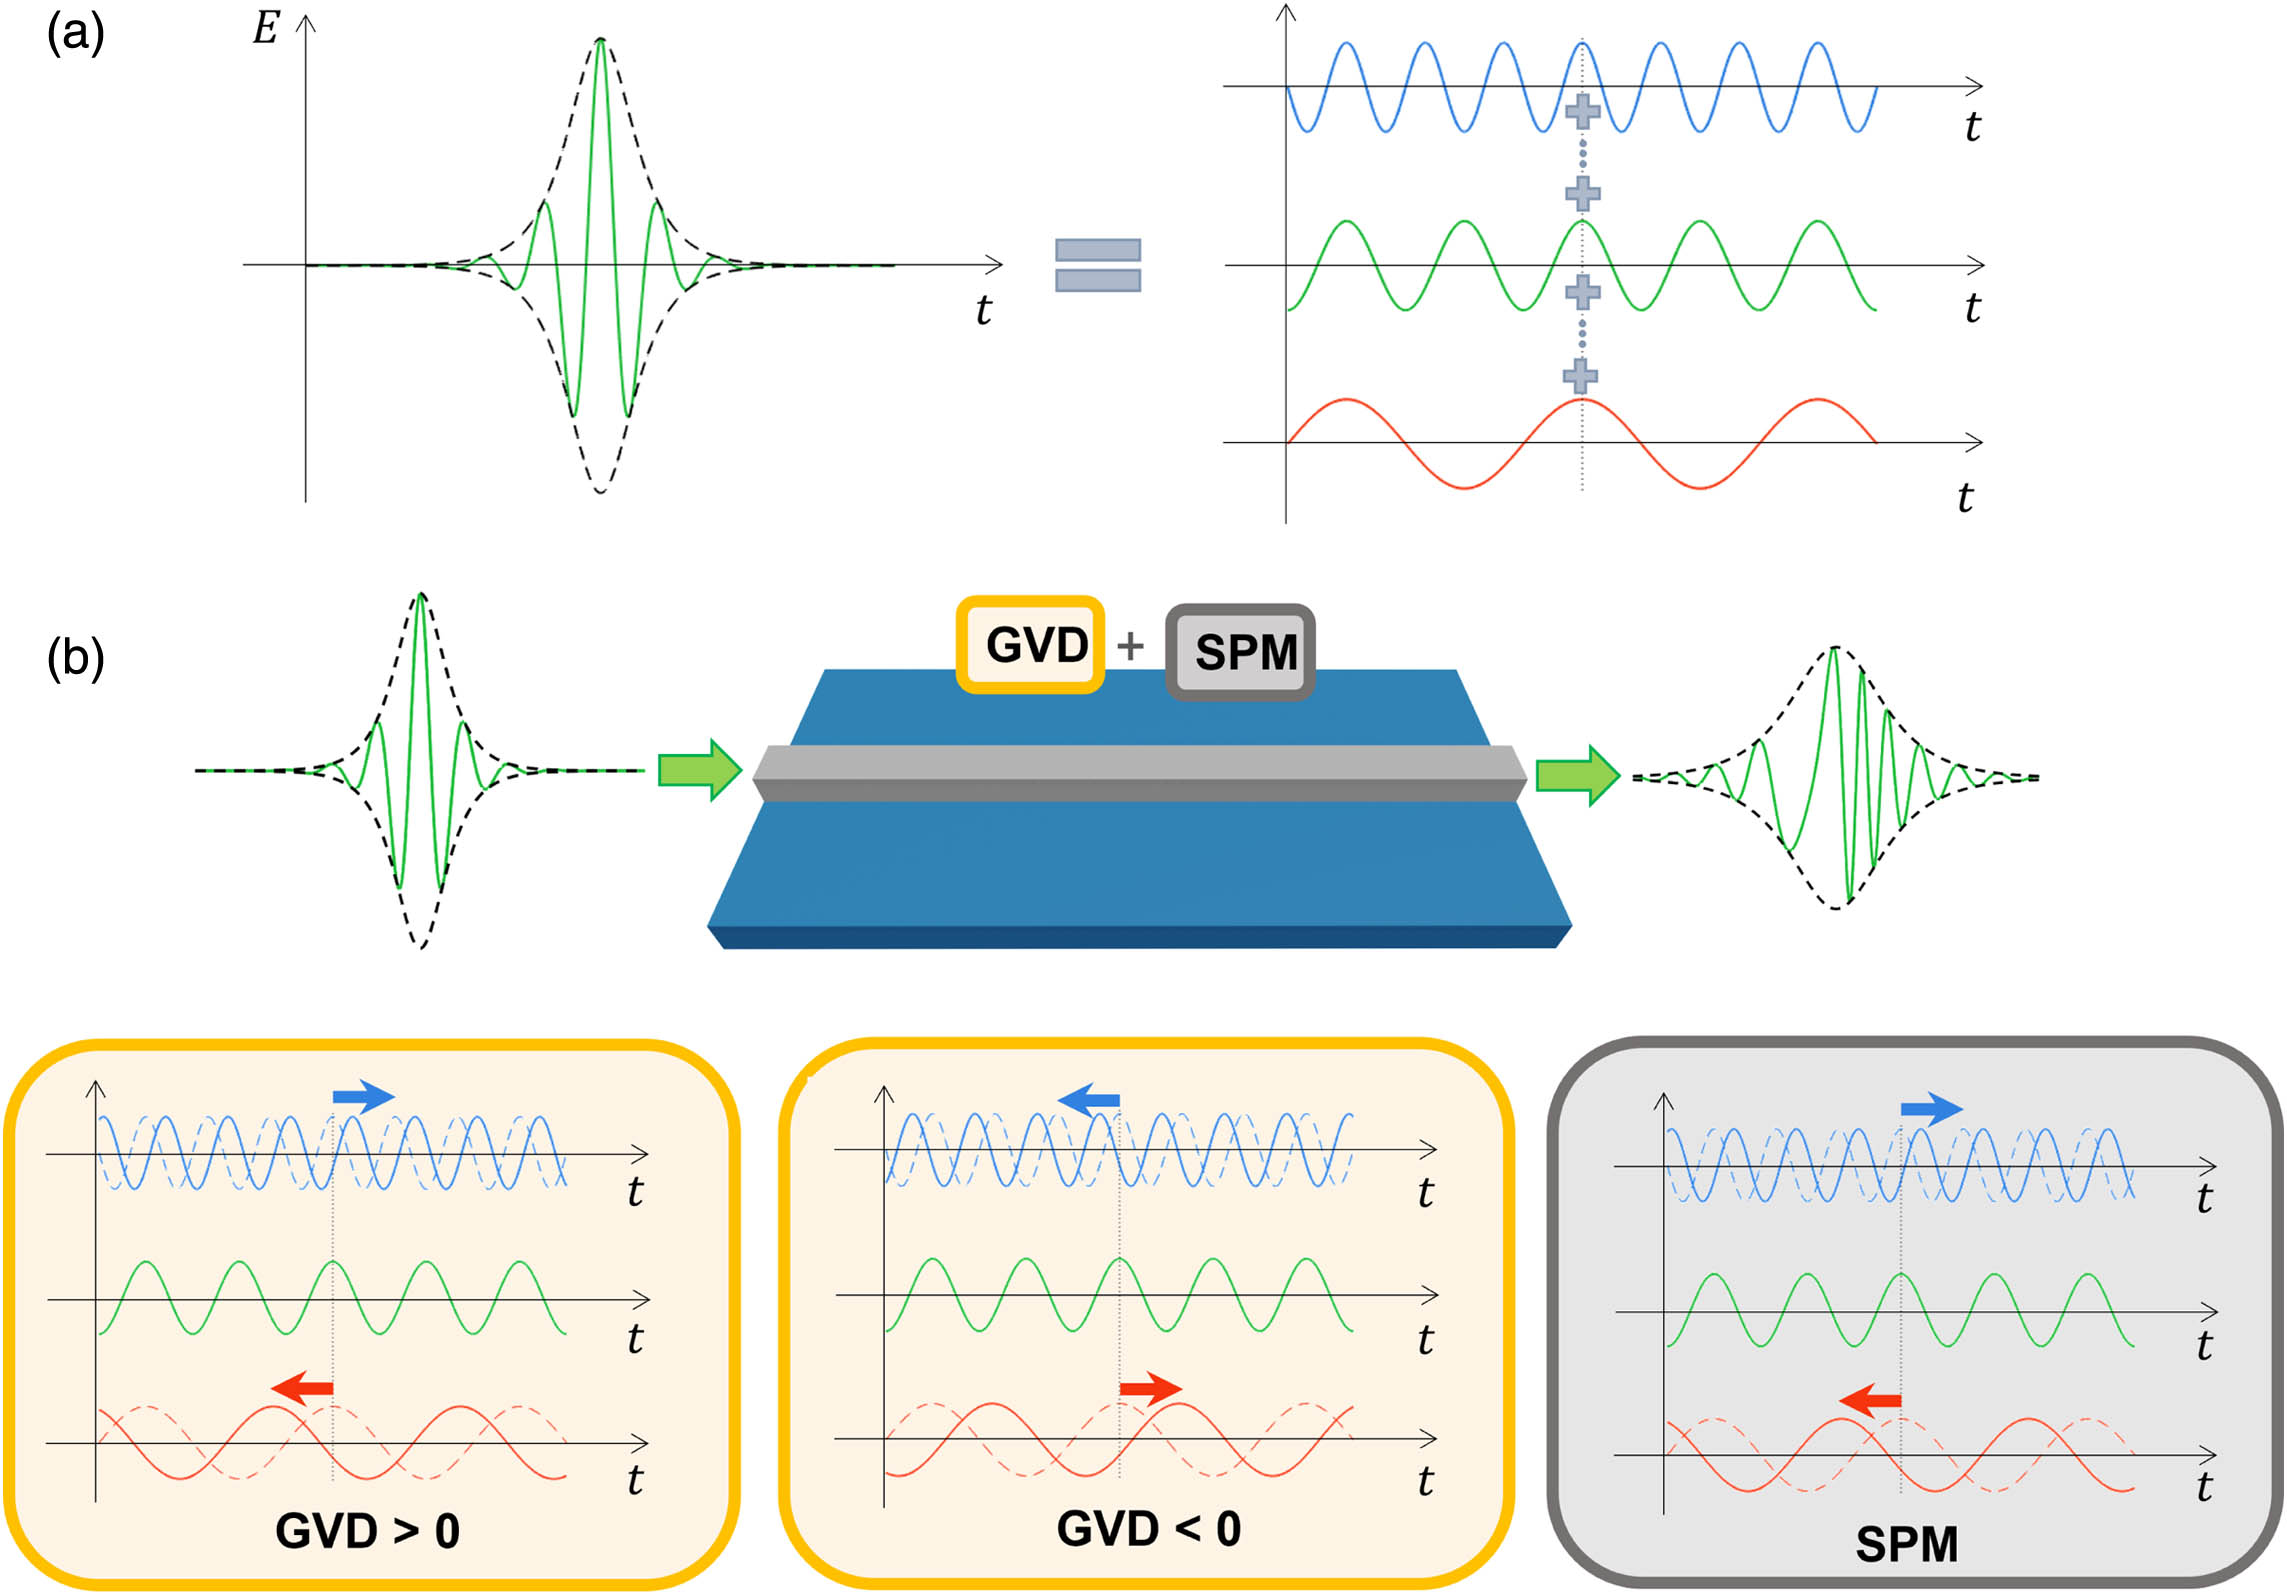
Fig. 1. Schematic representation of the effect of SPM and GVD on an optical pulse. (a) Simplified representation of an optical pulse with the carrier wave (green curve) shaped by a temporal envelope (black dashed curve). The pulse is the summation of several frequency components. Three of these components are schematically represented on the right graph (high-frequency in blue, central-frequency in green, and low-frequency in red). (b) Simplified representation of the processes of SPM and GVD along a waveguide. Both effects play a role on the relative phase of each spectral component of the initial pulse: each spectral component of the pulse is delayed or advanced relative to the carrier wave (green curve) after propagating in the waveguide.
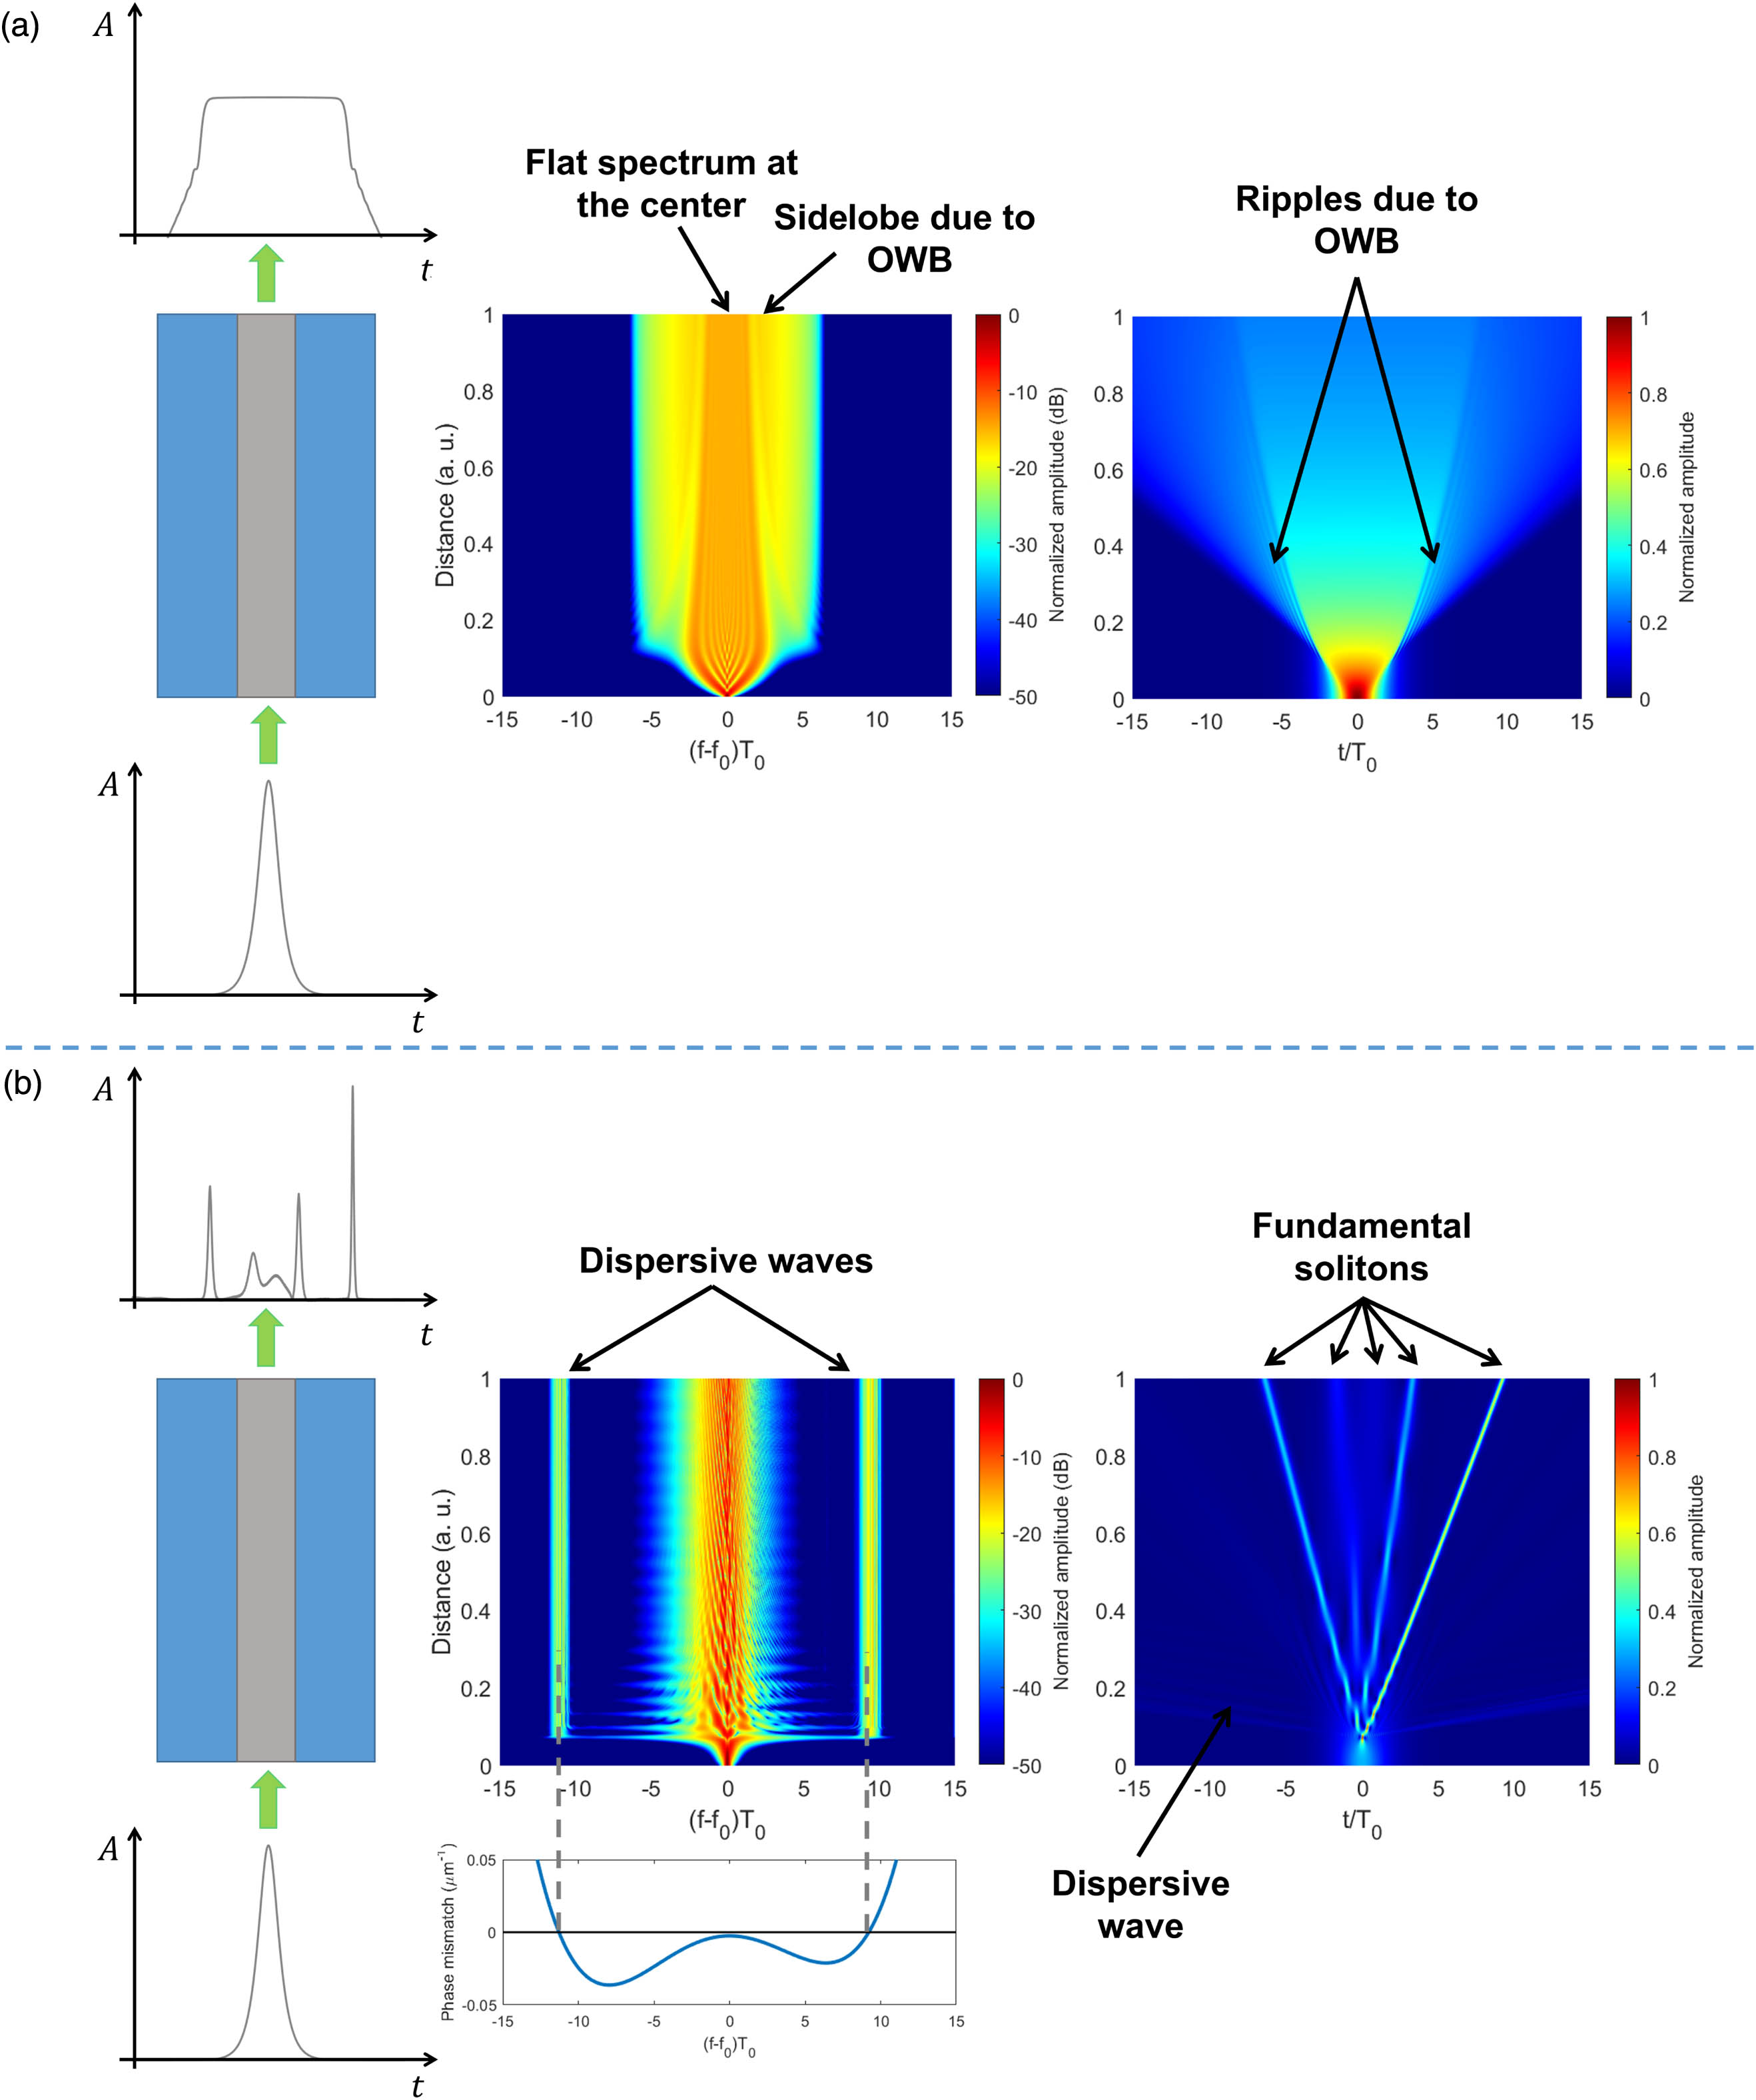
Fig. 2. Numerical simulation of a pulse propagating in a nonlinear medium. (a) Propagation in the normal dispersion regime, showing OWB; (b) SCG resulting from soliton fission of a fifth-order soliton in presence of third- and fourth-order HOD. The phase mismatch graph, calculated from Eq. (7 ), shows the prediction of the DW positions (zero-crossing points).
Fig. 3. Nonlinear index of commonly used materials in Si nonlinear photonics over their transparency windows. The height of the boxes represent the range of variation and the uncertainties on the values of n 2
Fig. 4. Examples of SCG results in Si waveguides. Top row shows the schematic representations of the waveguide geometries; bottom row shows the corresponding results (spectra). (a) and (d) SOI platform, from Ref. [39]; (b) and (e) Si on sapphire platform, from Ref. [40]; (c) and (f) suspended Si waveguide [41].
Fig. 5. SCG in dispersion-managed waveguides, from Ref. [48] with the permission of APS Physics, Copyright (2018) by the American Physical Society.
Fig. 6. Results on the graded SiGe platform, from Ref. [53]. (a) Schematic representation of the waveguide geometry with the linearly increasing Ge concentration profile along the vertical axis; (b) and (c) experimental and simulated (spectral density in black, coherence in blue) results for a pump wavelength of 7.5 μm, respectively. The purple dashed line shows the dip due to CO 2
Fig. 7. Two octaves spanning SCG in nitrogen-rich SiN x
|
Table 1. Main Parameters of the Different Platforms for SCG Presented in the Reviewa

Set citation alerts for the article
Please enter your email address
© Copyright 2018-2021 | Chinese Laser Press. All Rights Reserved 沪ICP备15018463号-20