
Fangfang Hu, Hailin Gong, Jie Wang, Rongfei Wei, Hai Guo. Structure and Spectral Properties of NaY2F7∶Eu3+/Eu2+ Transparent Glass-Ceramics[J]. Laser & Optoelectronics Progress, 2021, 58(15): 1516020
- Laser & Optoelectronics Progress
- Vol. 58, Issue 15, 1516020 (2021)
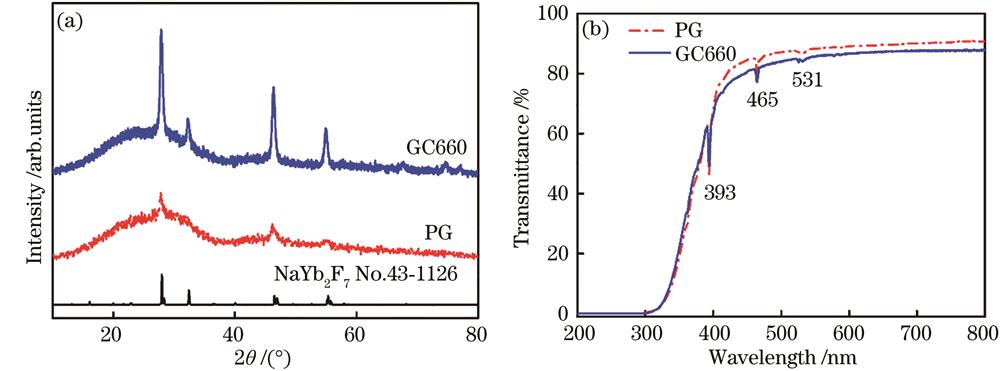
Fig. 1. Experimental results. (a) X-ray diffraction spectra of precursor glass PG and glass ceramics GC660 samples and NaYb2F7 standard card (PDF No.: 43-1126); (b) transmittance spectra of precursor glass and glass ceramics GC660 samples
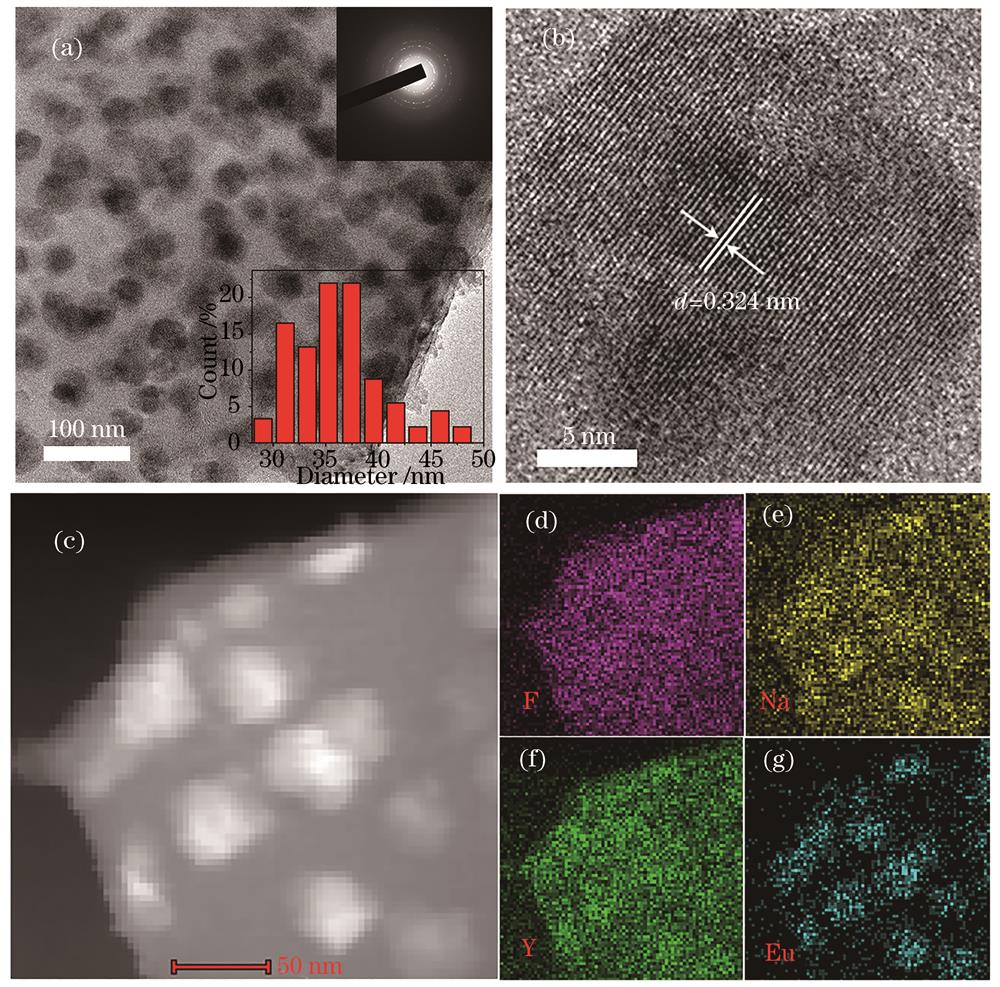
Fig. 2. Electron microscopy. (a) Transmission electron microscopy of GC660 sample; (b) high resolution transmittance electron microscopy of GC660 sample; (c) high angle annular dark field-scanning transmission electron microscopy and (d) F, (e) Na, (f) Y, and (g) Eu elements distribution of GC660 samples
Fig. 3. Spectra. (a) Excitation and emission spectra of Eu2+ in PG and GC660 samples (λem=425 nm, λex=340 nm); (b) excitation and emission spectra of Eu3+ in PG and GC660 samples (λem=613 nm, λex=393 nm)
Fig. 4. Decay curves of Eu2+ and Eu3+ in PG and GC660 sample. (a) 5d→4f transition of Eu2+; (b) 5D0→7F2 transition of Eu3+
Fig. 5. Spactra. (a) Excitation spectra of Eu3+ (λem=613 nm) and emission spectra of Eu2+(λex=350 nm); (b) excitation spectra of Eu3+ (λem=613 nm) and Eu2+ (λem=425 nm)
Fig. 6. Emission spectra of PG and GC660 under excitation of 344 nm
Fig. 7. Results of GC660 samples excited by different excitation wavelengths (340‒400 nm). (a) Emission spectra; (b) CIE coordinate plots
Fig. 8. Experimental results. (a) Temperature-dependent spectra of GC660 samples (λex=380 nm); (b) relationship between relative integrated emission intensities of Eu2+ and Eu3+ and temperature

Set citation alerts for the article
Please enter your email address
© Copyright 2018-2021 | Chinese Laser Press. All Rights Reserved 沪ICP备15018463号-20