• Laser & Optoelectronics Progress
  • Vol. 58, Issue 16, 1615005 (2021)
Yuhao Ning1, Yu Liu1, and Shaochu Wang1、2、*
Author Affiliations
  • 1School of Microelectronics, Tianjin University, Tianjin 300072, China
  • 2Tianjin Institute of Surveying and Mapping Co., Ltd., Tianjin 300381, China
  • show less
    DOI: 10.3788/LOP202158.1615005 Cite this Article Set citation alerts
    Yuhao Ning, Yu Liu, Shaochu Wang. Salient Detection of Multisource Image Illumination and Edge Fusion[J]. Laser & Optoelectronics Progress, 2021, 58(16): 1615005 Copy Citation Text show less
    Architecture of proposed algorithm
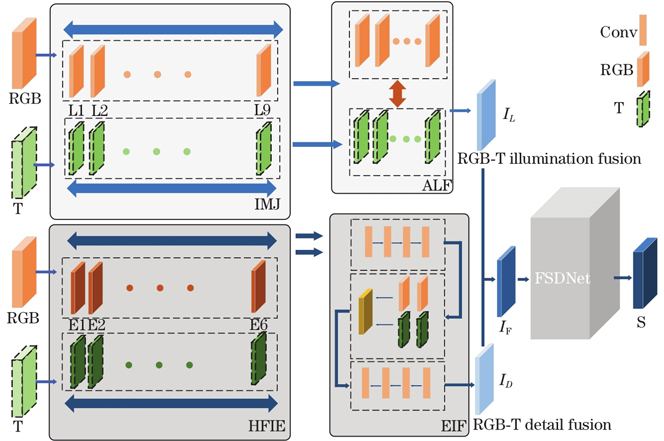
    Fig. 1. Architecture of proposed algorithm
    Block diagram of RGB-T image detail information fusion
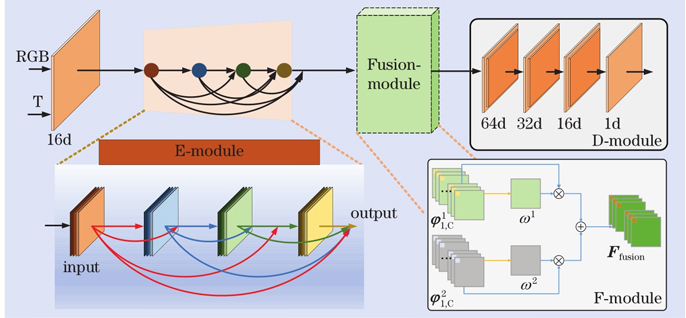
    Fig. 2. Block diagram of RGB-T image detail information fusion
    Architecture of the proposed FSDNet module
    Fig. 3. Architecture of the proposed FSDNet module
    Salient map comparison between different algorithms. (a) RGB images; (b) T images; (c) EGNet; (d) EGNet+;(e) CPDNet; (f) CPDNet+; (g) PoolNet; (h) PoolNet+; (i) DMRA; (j) A2dele; (k) proposed algorithm; (l) GT
    Fig. 4. Salient map comparison between different algorithms. (a) RGB images; (b) T images; (c) EGNet; (d) EGNet+;(e) CPDNet; (f) CPDNet+; (g) PoolNet; (h) PoolNet+; (i) DMRA; (j) A2dele; (k) proposed algorithm; (l) GT
    P-R curves of different algorithms at different datasets. (a) VT821; (b) VT1000
    Fig. 5. P-R curves of different algorithms at different datasets. (a) VT821; (b) VT1000
    Qualitative comparison of salient maps for ablation analysis. (a) RGB images; (b) T images; (c) Baseline; (d) +I; (e) +IA; (f) proposed algorithm; (g) -E; (h) GT
    Fig. 6. Qualitative comparison of salient maps for ablation analysis. (a) RGB images; (b) T images; (c) Baseline; (d) +I; (e) +IA; (f) proposed algorithm; (g) -E; (h) GT
    ConditionL1L2L3L4L5L6L7L8L9
    U0.150.250.350.450.550.650.750.851
    Q00.150.250.350.450.550.650.750.85
    Table 1. RGB, T image illumination classification
    ParameterL1L2L3L4L5L6L7L8L9
    η0.90.80.70.60.50.40.30.20.1
    Table 2. RGB, T image light fusion ratio
    ParameterR1R2R3R4R5R6
    σ234567
    K2457810
    Table 3. Detail information extraction of RGB、T image
    LL1L2L3L4L5L6L7L8L9
    DR6R6R5R4R3R2R2R1R1
    Table 4. RGB、T Image fusion rules
    AlgorithmVT821VT1000
    FmaxFaveMAEFmaxFaveMAE
    EGNet0.77170.74590.05120.87960.86370.0400
    EGNet+0.69940.64750.1160.78400.74530.0938
    CPDNet0.79710.78820.04250.88690.86210.0326
    CPDNet+0.79150.77960.04710.87380.85700.0333
    PoolNet0.81920.80460.04850.87950.86510.0411
    PoolNet+0.81770.80860.04110.87590.86560.0313
    DMRA0.84110.82700.04170.86130.84440.0381
    A2dele0.75130.74820.06210.86090.85750.0401
    CGL0.7800.7440.08490.727
    CRA0.7470.7390.10830.693
    Proposed algorithm0.84330.82910.03750.90950.89430.0268
    Table 5. Quantitative comparison of different algorithms
    AlgorithmFmaxFaveMAE
    EGNet0.66020.58250.1100
    EGNet+0.83930.81360.0616
    EGNet++0.82250.80360.0538
    CPDNet0.76620.70920.1060
    CPDNet+0.80710.78270.0721
    CPDNet++0.81640.80380.0546
    PoolNet0.58030.55780.1140
    PoolNet+0.79220.76830.0622
    PoolNet++0.75320.71350.0940
    Proposed algorithm0.87430.86510.0386
    Table 6. Test results in VT1000 low light data subset
    AlgorithmVT821VT1000
    FmaxFaveMAEFmaxFaveMAE
    Baseline0.82560.80030.04450.83960.83150.0361
    +I0.83260.81250.04290.84590.83610.0342
    +IA0.84930.81390.04170.89560.88270.0330
    Proposed algorithm0.84330.82910.03750.90950.89430.0268
    -E0.83660.81930.04110.90510.88190.0271
    Table 7. Quantitative comparison results of ablation analysis
    Yuhao Ning, Yu Liu, Shaochu Wang. Salient Detection of Multisource Image Illumination and Edge Fusion[J]. Laser & Optoelectronics Progress, 2021, 58(16): 1615005
    Download Citation