
Ge Mu, Tianyu Rao, Menglu Chen, Yimei Tan, Qun Hao, Xin Tang, "Colloidal quantum-dot light emitting diodes with bias-tunable color," Photonics Res. 10, 1633 (2022)
- Photonics Research
- Vol. 10, Issue 7, 1633 (2022)
Abstract
1. INTRODUCTION
Colloidal quantum dots (QDs) have been extensively investigated as promising alternative visible emitters to traditional inorganic bulk phosphors and organic luminescent materials owing to their tunable emission wavelengths, narrow spectral bandwidths, excellent photoluminescent (PL) quantum yield, and solution-process compatibility [1–4]. Since the first demonstration of colloidal QD light emitting diodes (QLEDs) in 1994 [5], the performance of monochromatic QLEDs has been significantly improved including luminance, external quantum efficiency (EQE), and device stability by optimizing the device structures and material properties [6–10]. Although monochromatic QLEDs show excellent performance such as maximum luminance up to 23,040, 218,800, and
Conventional full-color QLEDs are fabricated by side-by-side patterning of R/G/B QDs through a photolithography approach [13,14], ink-jets [15,16], or contact printing [17]. Besides reduced fill factors and pixel density resulting from the lateral integration configuration, other key figures of merit such as operation lifetime, film uniformity, and interfacial charge transport efficiency can be deteriorated due to incompatibility with lithographical chemicals [12,18] or coffee ring effects [14,16]. Instead of directly patterning light emitting layers (EMLs), the combination of white QLEDs and color filters can also realize R/G/B side-by-side color pixels [4,19]. Despite large-area full-color QLED displays being accomplished [20–22], the luminance of QLEDs is markedly weakened because over 2/3 of the emitted light is absorbed by color filters [11].
To circumvent the limitation of R/G/B side-by-side color pixels, there is a trend to develop color-tunable LEDs that can emit full colors under different driving conditions. The pixel density and fill factor of a display with color-tunable pixels can be enhanced by three times over conventional displays with R/G/B side-by-side pixels because full color is attained in a single color-tunable pixel instead of three R/G/B pixels, which can significantly enhance the resolution of full-color QLED displays, as shown in Fig. 1 [11]. Early attempts use vertical integration construction including the development of QLEDs with layer-by-layer stacked R/G/B QD films [23,24] and tandem-structure R/G/B QLEDs [25]. Full-color light emission was indeed achieved, but the alternatingly consecutive solvent treatments inevitably damage the prior-deposited QD films and degrade interfacial carrier transport efficiency. High-performance QLEDs with wide spectral tunability remain technological challenging.
Sign up for Photonics Research TOC. Get the latest issue of Photonics Research delivered right to you!Sign up now
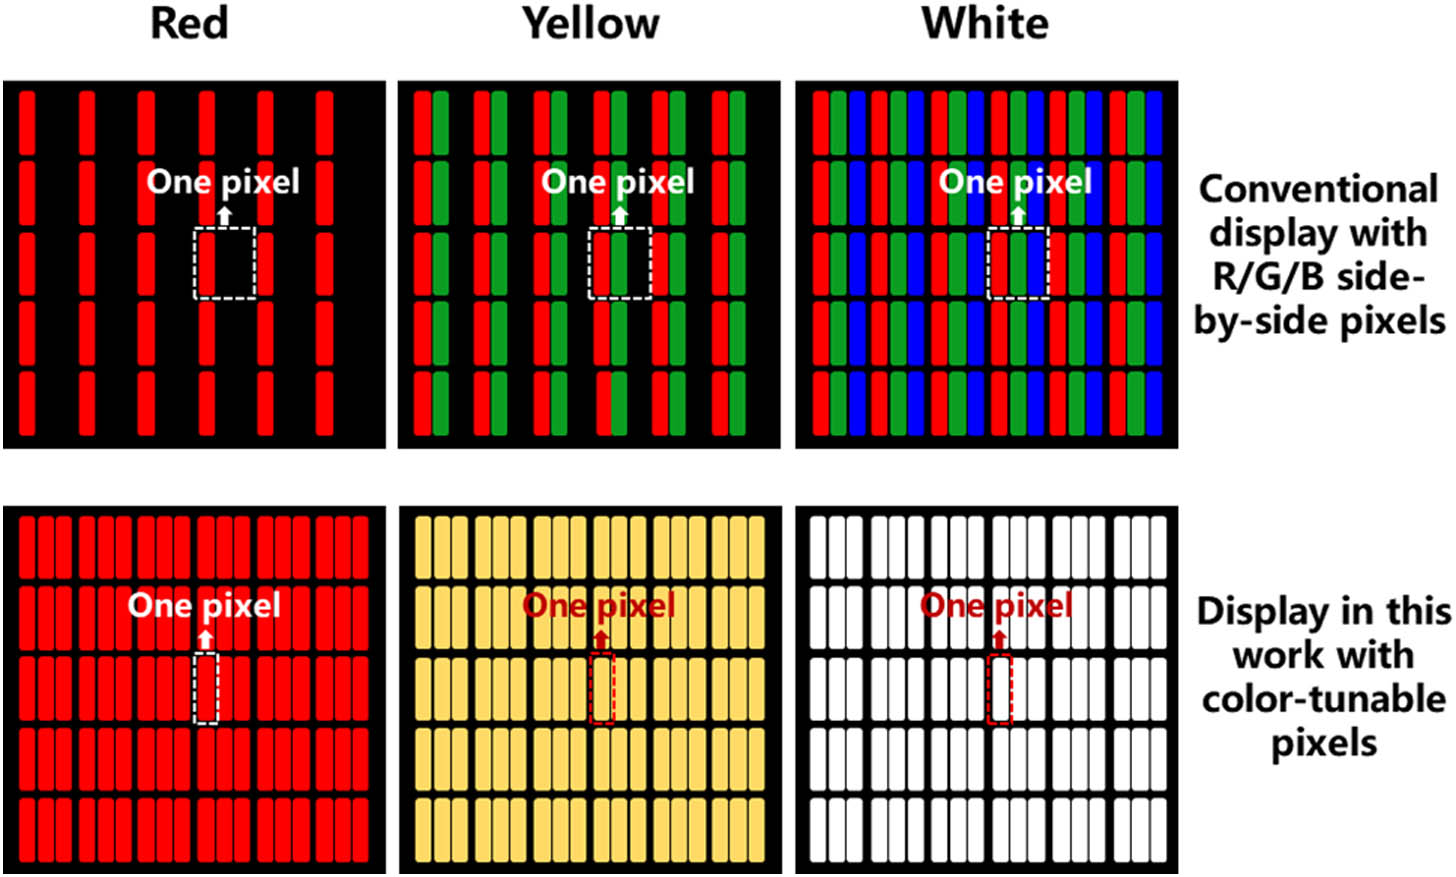
Figure 1.Pixel arrangement of the conventional display with R/G/B side-by-side pixels and display in this work with color-tunable pixels.
To address these challenges, single QLEDs that can emit full colors under different driving bias voltages are innovatively proposed in this work by using mixed R/G/B QDs as light emitting materials. Without patterning techniques or color filters, the multi-color QLEDs exhibit color-saturated emission from the Commission Internationale de l’Eclairage (CIE) chromaticity coordinates of red (0.649, 0.330) to orange (0.453, 0.389) to yellow (0.350, 0.347) to green (0.283, 0.305) to blue (0.255, 0.264) upon increasing voltages with a high luminance of about
2. MATERIALS AND METHODS
A. Materials
Cadmium selenide/zinc selenide (CdSe@ZnS) red, green, and blue QDs, and zinc oxide (ZnO) nanoparticles were purchased from Suzhou Xingshuo Nano Technology in China. Poly(ethylenedioxythiophene): polystyrenesulfonate (PEDOT: PSS, AI 4083) and poly(9,9-dioctylfluorene-co-N-(4-(3-methylpropyl))diphenylamine) (TFB) were purchased from Xi’an Polymer Light Technology in China.
B. Device Fabrication
The QLEDs were fabricated on patterned indium tin oxide (ITO) glass substrates, which were cleaned in deionized water, acetone, ethanol, and isopropyl alcohol sequentially through an ultrasound process and then treated by plasma for 15 min. PEDOT: PSS solutions were spin-coated onto ITO-coated glass substrates at 5000 r/min for 40 s and baked in air at 150°C for 15 min. After that, the PEDOT: PSS-coated substrates were transferred into a nitrogen-filled glovebox. TFB dissolved in chlorobenzene was deposited by spin-coating at 2000 r/min for 40 s and baked at 130°C for 30 min. QD blended solutions were prepared by mixing the red (
Volume Ratios of Mixed R/G/B QDs Used for Fabrication of Full-Color-Tunable QLEDs
| Proportion in Mixed R/G/B QDs | |||
|---|---|---|---|
| Formulation | Red QDs | Green QDs | Blue QDs |
| Formulation A | 1 | 0.4 | 0.6 |
| Formulation B | 1 | 7.1 | 6.7 |
| Formulation C | 1 | 3 | 55 |
C. Characterization
High-resolution transmission electron microscopy (HR-TEM) images of QD materials were obtained using a JEM 2100F TEM instrument. Room temperature UV-Vis absorption spectra were measured using a V-770 UV–Vis–NIR spectrophotometer (Jasco). PL spectra were collected on a spectral luminance meter (OHSP-350L). Cross-sectional TEM images and energy-dispersive x-ray spectroscopy (EDS) compositional mapping images of the devices were achieved by a Thermo Fisher Helios G4 UC using focused ion beam (FIB) milling techniques. The electroluminescence (EL) spectra and CIE chromaticity coordinates were recorded with a spectral luminance meter (OHSP-350L). The current versus voltage characteristics were measured using a Keithley 2460B source meter. The current density was calculated by the current value obtained through the Keithley 2460B source meter divided by the active area of QLED. The luminance of QLED was characterized by a calibrated spectral luminance meter (OHSP-350L). The EQE is calculated according to the formula
3. RESULTS AND DISCUSSION
A. Device Architecture and Physics
Our devices consist of ITO as the anode, PEDOT: PSS as the hole injection layer (HIL), TFB as the hole transport layer (HTL), mixed R/G/B QDs as EML, ZnO as the electron injection layer (EIL) and electron transport layer (ETL), and Ag as the cathode, as shown in Fig. 2(a). All functional layers were deposited through solution-processed methods except for the Ag electrode deposited by vacuum thermal evaporation. Combining the cross-sectional TEM images [Fig. 2(b) panel I] and EDS compositional mapping images [Fig. 2(b) panels II to V], the multilayered structure can be observed, and boundaries of different layers in QLEDs are distinguished clearly.
![]()
Figure 2.Architecture and physics of QLEDs with bias-tunable color. (a) Schematic of the device architecture. (b) Cross-sectional TEM image (I) and EDS compositional mapping images (II–V) of the fabricated QLEDs. (c) Energy band diagram of QLEDs. (d) HR-TEM images of R/G/B QD materials. Absorption spectra and normalized PL spectra of (e) R, (f) G, and (g) B QDs.
The energy band diagram of QLEDs is illustrated in Fig. 2(c). Because QDs inherently possess lower valence bands of
The mean diameters of R/G/B CdSe–ZnS QD materials are measured to be around 10 nm, as shown in the HR-TEM images of QD materials in Fig. 2(d). All R/G/B QDs show a homogeneous size distribution. PL peak emission wavelengths of R, G, and B QDs are 623, 526, and 463 nm, respectively, with a Stokes shift between the absorption spectra and PL spectra [Figs. 2(e)–2(g)]. R/G/B CdSe–ZnS QD materials display outstanding optical performance with full widths at half-maximum of 22, 24, and 24 nm, respectively.
B. Monochromatic R/G/B QLEDs
As a first step, the performance of individual monochromatic R/G/B QLEDs is characterized. The CIE color coordinates of each color are (0.689, 0.311), (0.149, 0.787), and (0.136, 0.050), respectively, which are almost located at the spectral locus, indicating the pure color of the emitted light [Fig. 3(a)]. R/G/B QLEDs can cover a large color triangle over 100% more than National Television Systems Committee (NTSC) color space, exhibiting a superior color gamut.
![]()
Figure 3.Performance of monochromatic R/G/B QLEDs. (a) CIE 1931 color coordinates of monochromatic R/G/B QLEDs. (b) Voltage-dependent normalized EL spectral evolutions of monochromatic R/G/B QLEDs. (c) Photographs of monochromatic R/G/B QLEDs (emitting area of
Figure 3(b) presents normalized EL spectra of monochromatic R/G/B QLEDs operated at different voltages. Uniform, pure, and bright emission of red, green, and blue colors can be observed from the photographs of R/G/B QLEDs at the applied voltage shown in Fig. 3(c). The current density versus voltage curves for R/G/B QLEDs are depicted in Fig. 3(d), exhibiting typical rectification characteristics. The turn-on voltages (required driving voltage for obtaining luminance of
C. QLEDs with Bias-Tunable Color
To obtain full-color-tunable QLEDs, an R/G/B QD blended solution is prepared for three proportions (Table 1), whose PL spectra are depicted in Figs. 4(a)–4(c). By using these mixed R/G/B QDs as a single EML, the light color emitted by QLEDs can be tuned through bias voltages. As shown in Fig. 4(a), the PL contribution of the red component is dominant for mixed R/G/B QDs with the formulation A ratio. As a result, the corresponding QLEDs exhibit a very small color change, mainly red color, when bias voltage changes [Fig. 4(d)]. Through increasing the proportions of green and blue QDs in mixed R/G/B QDs, as shown in the formulation B ratio, the predominant green and blue PL components over red are observed [Fig. 4(b)]. Accordingly, the color variation emitted by formulation B-based QLEDs becomes relatively pronounced as the bias voltage increases, from yellow with CIE 1931 of (0.462, 0.505) at 6 V to green with (0.375, 0.524) at 10 V [Fig. 4(d)].
![]()
Figure 4.Demonstration of QLEDs with bias-tunable color. Normalized PL spectra of mixed R/G/B QDs used for the fabrication of full-color-tunable QLEDs with (a) formulation A, (b) formulation B, and (c) formulation C. Evolution of CIE 1931 color coordinates of (d) formulation A, B, and (e) formulation C-based full-color-tunable QLEDs with increasing bias voltages. Inset of (e): CCT can be adjusted from 1500 to 10,000 K, which well traces the blackbody trajectory. (f) Evolution of CIE 1976 color coordinates of formulation C-based full-color-tunable QLEDs with increasing bias voltages. The asterisk represents the white QLEDs in (e) and (f). (g) Evolution of as-recorded EL spectra of formulation C-based full-color-tunable QLEDs with increasing bias voltages. (h) EL contribution of R/G/B individual color to the entire EL spectra of formulation C-based full-color-tunable QLEDs at different bias voltages. (i) Photographs of formulation C-based full-color-tunable QLEDs (emitting area of
For the purpose of more obvious color difference tuned by bias, formulation C-based mixed R/G/B QDs whose PL spectra display three peaks of R/G/B components with closer intensity than formulations A and B [Fig. 4(c)] were used for the fabrication of full-color-tunable QLEDs. As a result, the CIE 1931 color coordinates can successively move with voltages from (0.649, 0.330) for red, to (0.453, 0.389) for orange, to (0.350, 0.347) for yellow, to (0.283, 0.305) for green, and to (0.255, 0.264) for blue [Fig. 4(e)]. The evolution of corresponding CIE 1976 color coordinates for full-color-tunable QLEDs with increasing bias voltages is shown in Fig. 4(f). The color variation of formulation C-based QLEDs with voltages is much more remarkable than that of QLEDs with formulations A and B. To the best of our knowledge, rare studies have been able to achieve such an extensive region of color regulation in CIE color coordinates of QLEDs without R/G/B three primary color combination patterns, as shown in Table 2.
Comparison of Full-Color QLEDs
| Type | Pixel Density and | Manufacturing | References | Tunable Spectral Range | External Quantum |
|---|---|---|---|---|---|
| Lateral integration configuration with side-by-side patterning of R/G/B QDs | Low | Photolithography approach | 2020, Nano Res. [ | R (0.69, 0.31); G (0.16, 0.77); B (0.15, 0.07) | – |
| 2021, ACS Appl. Mater. Interfaces [ | – | R 4.5%; G 5.4%; B 4.7% | |||
| Ink-jet | 2017, Sci. China Chem [ | R (0.68, 0.31); G (0.20, 0.74); B (0.14, 0.05) | R 2.24%; G 3.31%; B 0.60% | ||
| Contact printing | 2008, Nano Lett. [ | R (0.66, 0.34); G (0.21, 0.70); B (0.18, 0.13) | R 1.0%; G 0.5%; B 0.2% | ||
| Vertical integration configuration | High | Layer-by-layer stacked R/G/B QDs films | 2019, Adv. Funct. Mater. [ | From (0.1174, 0.7679) to (0.1454, 0.0464) | – |
| 2010, Nano Lett. [ | Red, orange, yellow-green, and green | 0.3% | |||
| Tandem-structure R/G/B QLEDs | 2017, J. SID [ | White (0.30, 0.44) | 2.04% | ||
| Mixed R, G, and B QDs as light emitting layers | High | Combination of white QLEDs and color filters | 2017, ACS Appl. Mater. Interfaces [ | – | 0.37% |
| 2015, Nanoscale [ | (0.504, 0.449) at 6.5 V; (0.482, 0.438) at 9 V or (0.330, 0.253) at 7 V; (0.405, 0.348) at 9.5 V | 0.3%–0.6% | |||
| 2015, ACS Nano [ | (0.310, 0.229) at 5 V; (0.195, 0.172) at 9 V | 10.9% | |||
| 2014, Adv. Mater. [ | (0.33, 0.35) | 1% | |||
| 2018, Nano Res. [ | – | 0.65% | |||
| 2011, Nano Lett. [ | (0.336, 0.339) | 0.033% | |||
| Full-color-tunable QLEDs | This work | From red (0.649, 0.330) to orange (0.453, 0.389) to yellow (0.350,0.347) to green (0.283, 0.305) to blue (0.255,0.264) | 13.3% |
The trajectory of the color change in the CIE is closely related to the relative EL intensity variation of R/G/B individual color with bias voltages [Figs. 4(g) and 4(h)]. A strong bias voltage dependence of EL spectral evolutions of full-color-tunable QLEDs with formulation C is shown in Fig. 4(g). The corresponding EL contribution of R/G/B individual color to the entire EL spectra of full-color-tunable QLEDs at different bias voltages is presented in Fig. 4(h). The red EL dominates at a low bias voltage of 2 V, and the green and blue EL components gradually appear with higher bias voltages. When the bias voltage is increased, red EL components decrease, while the blue one becomes more intense, and the green one basically remains unchanged. A predominance of the blue EL component over red and green ones can be observed at a bias voltage reaching 9 V. The reasons for raising the EL contribution of the larger-bandgap QD to the entire EL spectra compared with the smaller-bandgap one with an increasing bias voltage are related to the electric-field-assisted inter-QD charge migration [4]. Because red QDs possess the smallest band offset at the QD/HTL interface among the three QDs [Fig. 2(c)], the main red EL component is observed at a low bias voltage. Upon increasing voltages, red QDs with the smallest bandgaps serve as hole transport particles whose leaky holes are transferred to the adjacent green and blue QDs, leading to the gradual quenching of the red EL [4].
The distinct color change in QLED photographs in Fig. 4(i) further demonstrates that QLEDs can be tuned through bias voltages to emit arbitrary colors inside the wide range shown in the black trajectory of CIE color coordinates [Figs. 4(e) and 4(f)]. QLEDs with bias-tunable color can significantly enhance the pixel density and fill factor of the display without traditional R, G, and B sub-pixels, achieving high-resolution full-color QLED displays. Furthermore, the emitting area of QLEDs in our work (
The current density of full-color-tunable QLEDs as a function of applied voltage is shown in Fig. 5(a). Figure 5(a) shows luminance versus bias voltage for full-color-tunable QLEDs; the luminance increases with the driving voltage, reaching a peak of luminance approaching
![]()
Figure 5.Performance of QLEDs with bias-tunable color. (a) Luminance and current density versus bias voltage for full-color-tunable QLEDs. (b) EQE versus bias voltage for full-color-tunable QLEDs. (c) Performance comparison of R/G/B QDs-mixed full-color QLEDs [1,2,4,20,20,28].
D. White QLEDs
Combining white QLEDs with color filters is also an efficient strategy to realize high-resolution full-color displays, as previously mentioned. Interestingly, full-color-tunable QLEDs can emit pure white light with CIE 1931 chromaticity coordinates of (0.316, 0.325) at the bias voltage of 6.4 V, as exhibited by the asterisks in Figs. 4(e) and 4(f). In addition, the CIE color coordinates of white QLEDs can be tuned to trace the blackbody locus, and the CCT can be adjusted for a wide range from 1500 to 10,000 K, as presented in the inset of Fig. 4(e). The CRI and EQE of white QLEDs are 70 and 5.3% [Fig. 5(b)], respectively, which are much higher than those of other representative white QLEDs [2,11,20,21,29]. Although the luminance of the present white QLEDs has room to be improved, the tunable wide range of CCT, the high CRI, and the outstanding EQE of white QLEDs enable them to provide a possibility for high-efficiency lighting applications.
4. CONCLUSION
In summary, we successfully achieve full-color QLEDs with bias-tunable emission spectra by engineering mixed R/G/B QDs as EMLs prepared through a simple yet effective all-solution-processed method. First, monochromatic R/G/B QLEDs having high luminance of 4580, 3870, and
References
[1] S. Wepfer, J. Frohleiks, A. R. Hong, H. S. Jang, G. Bacher, E. Nannen. Solution-processed CuInS2-based white QD-LEDs with mixed active layer architecture. ACS Appl. Mater. Interfaces, 9, 11224-11230(2017).
[2] J. H. Kim, K. H. Lee, H. D. Kang, B. Park, J. Y. Hwang, H. S. Jang, Y. R. Do, H. Yang. Fabrication of a white electroluminescent device based on bilayered yellow and blue quantum dots. Nanoscale, 7, 5363-5370(2015).
[3] H. Shen, Q. Gao, Y. Zhang, Y. Lin, Q. Lin, Z. Li, L. Chen, Z. Zeng, X. Li, Y. Jia, S. Wang, Z. Du, L. S. Li, Z. Zhang. Visible quantum dot light-emitting diodes with simultaneous high brightness and efficiency. Nat. Photonics, 13, 192-197(2019).
[4] K. H. Lee, C. Y. Han, H. D. Kang, H. Ko, C. Lee, J. Lee, N. S. Myoung, S. Y. Yim, H. Yang. Highly efficient, color-reproducible full-color electroluminescent devices based on red/green/blue quantum dot-mixed multilayer. ACS Nano, 9, 10941-10949(2015).
[5] V. L. Colvin, M. C. Schlamp, A. P. Alivisatos. Light-emitting diodes made from cadmium selenide nanocrystals and a semiconducting polymer. Nature, 370, 354-357(1994).
[6] X. Dai, Z. Zhang, Y. Jin, Y. Niu, H. Cao, X. Liang, L. Chen, J. Wang, X. Peng. Solution-processed, high-performance light-emitting diodes based on quantum dots. Nature, 515, 96-99(2014).
[7] Y. Shirasaki, G. J. Supran, M. G. Bawendi, V. Bulović. Emergence of colloidal quantum-dot light-emitting technologies. Nat. Photonics, 7, 13-23(2013).
[8] J. Kwak, W. K. Bae, D. Lee, I. Park, J. Lim, M. Park, H. Cho, H. Woo, D. Y. Yoon, K. Char, S. Lee, C. Lee. Bright and efficient full-color colloidal quantum dot light-emitting diodes using an inverted device structure. Nano Lett., 12, 2362-2366(2012).
[9] L. Qian, Y. Zheng, J. Xue, P. H. Holloway. Stable and efficient quantum-dot light-emitting diodes based on solution-processed multilayer structures. Nat. Photonics, 5, 543-548(2011).
[10] W. K. Bae, Y. S. Park, J. Lim, D. Lee, L. A. Padilha, H. McDaniel, I. Robel, C. Lee, J. M. Pietryga, V. I. Klimov. Controlling the influence of Auger recombination on the performance of quantum-dot light-emitting diodes. Nat. Commun., 4, 2661(2013).
[11] H. Zhang, Q. Su, S. Chen. Quantum-dot and organic hybrid tandem light-emitting diodes with multi-functionality of full-color-tunability and white-light-emission. Nat. Commun., 11, 2826(2020).
[12] J. Yang, D. Hahm, K. Kim, S. Rhee, M. Lee, S. Kim, J. H. Chang, H. W. Park, J. Lim, M. Lee, H. Kim, J. Bang, H. Ahn, J. H. Cho, J. Kwak, B. S. Kim, C. Lee, W. K. Bae, M. S. Kang. High-resolution patterning of colloidal quantum dots via non-destructive, light-driven ligand crosslinking. Nat. Commun., 11, 2874(2020).
[13] W. Mei, Z. Zhang, A. Zhang, D. Li, X. Zhang, H. Wang, Z. Chen, Y. Li, X. Li, X. Xu. High-resolution, full-color quantum dot light-emitting diode display fabricated via photolithography approach. Nano Res., 13, 2485-2491(2020).
[14] G. H. Kim, J. Lee, J. Y. Lee, J. Han, Y. Choi, C. J. Kang, K. B. Kim, W. Lee, J. Lim, S. Y. Cho. High-resolution colloidal quantum dot film photolithography via atomic layer deposition of ZnO. ACS Appl. Mater. Interfaces, 13, 43075-43084(2021).
[15] C. Jiang, L. Mu, J. Zou, Z. He, Z. Zhong, L. Wang, M. Xu, J. Wang, J. Peng, Y. Cao. Full-color quantum dots active matrix display fabricated by ink-jet printing. Sci. China Chem., 60, 1349-1355(2017).
[16] L. Xie, X. Xiong, Q. Chang, X. Chen, C. Wei, X. Li, M. Zhang, W. Su, Z. Cui. Inkjet-printed high-efficiency multilayer QLEDs based on a novel crosslinkable small-molecule hole transport material. Small, 15, 1900111(2019).
[17] L. A. Kim, P. O. Anikeeva, S. A. Coe-Sullivan, J. S. Steckel, M. G. Bawendi, V. Bulović. Contact printing of quantum dot light-emitting devices. Nano Lett., 8, 4513-4517(2008).
[18] H. L. Kang, J. Kang, J. K. Won, S. M. Jung, J. Kim, C. H. Park, B. K. Ju, M. G. Kim, S. K. Park. Spatial light patterning of full color quantum dot displays enabled by locally controlled surface tailoring. Adv. Opt. Mater., 6, 1701335(2018).
[19] C.-W. Han, Y.-H. Tak, B.-C. Ahn. 15-in. RGBW panel using two-stacked white OLED and color filters for large-sized display applications. J. Soc. Inf. Disp., 19, 190(2011).
[20] W. K. Bae, J. Lim, D. Lee, M. Park, H. Lee, J. Kwak, K. Char, C. Lee, S. Lee. R/G/B/Natural white light thin colloidal quantum dot-based light-emitting devices. Adv. Mater., 26, 6387-6393(2014).
[21] Y. Zhang, C. Xie, H. Su, J. Liu, S. Pickering, Y. Wang, W. W. Yu, J. Wang, Y. Wang, J. I. Hahm, N. Dellas, S. E. Mohney, J. Xu. Employing heavy metal-free colloidal quantum dots in solution-processed white light-emitting diodes. Nano Lett., 11, 329-332(2011).
[22] Y. Fan, H. Zhang, J. Chen, D. Ma. Three-peak top-emitting white organic emitting diodes with wide color gamut for display application. Org. Electron., 14, 1898-1902(2013).
[23] J. Zhang, B. Ren, S. Deng, J. Huang, L. Jiang, D. Zhou, X. Zhang, M. Zhang, R. Chen, F. Yeung, H. S. Kwok, P. Xu, G. Li. Voltage-dependent multicolor electroluminescent device based on halide perovskite and chalcogenide quantum-dots emitters. Adv. Funct. Mater., 30, 1907074(2020).
[24] W. Ki Bae, J. Kwak, J. Lim, D. Lee, M. Ki Nam, K. Char, C. Lee, S. Lee. Multicolored light-emitting diodes based on all-quantum-dot multilayer films using layer-by-layer assembly method. Nano Lett., 10, 2368-2373(2010).
[25] H. Zhang, S. Wang, X. Sun, S. Chen. All solution-processed white quantum-dot light-emitting diodes with three-unit tandem structure. J. Soc. Inf. Disp., 25, 143-150(2017).
[26] D. Liu, S. Cao, S. Wang, H. Wang, W. Dai, B. Zou, J. Zhao, Y. Wang. Highly stable red quantum dot light-emitting diodes with long
[27] D. Chen, D. Chen, X. Dai, Z. Zhang, J. Lin, Y. Deng, Y. Hao, C. Zhang, H. Zhu, F. Gao, Y. Jin. Shelf-stable quantum-dot light-emitting diodes with high operational performance. Adv. Mater., 32, 2006178(2020).
[28] B. C. Hames, I. Mora-Seró, R. S. Sánchez. Device performance and light characteristics stability of quantum-dot-based white-light-emitting diodes. Nano Res., 11, 1575-1588(2018).
[29] H. Zhang, H. Li, X. Sun, S. Chen. Inverted quantum-dot light-emitting diodes fabricated by all-solution processing. ACS Appl. Mater. Interfaces, 8, 5493-5498(2016).


Set citation alerts for the article
Please enter your email address

© Copyright 2018-2021 | Chinese Laser Press. All Rights Reserved 沪ICP备15018463号-20