• Photonics Research
  • Vol. 10, Issue 7, 1633 (2022)
Ge Mu1、2, Tianyu Rao1, Menglu Chen1、2、3, Yimei Tan3, Qun Hao1、2、3、4, and Xin Tang1、2、3、*
Author Affiliations
  • 1School of Optics and Photonics, Beijing Institute of Technology, Beijing 100081, China
  • 2Beijing Key Laboratory for Precision Optoelectronic Measurement Instrument and Technology, Beijing 100081, China
  • 3Yangtze Delta Region Academy of Beijing Institute of Technology, Jiaxing 314019, China
  • 4e-mail: qhao@bit.edu.cn
  • show less
    DOI: 10.1364/PRJ.456043 Cite this Article Set citation alerts
    Ge Mu, Tianyu Rao, Menglu Chen, Yimei Tan, Qun Hao, Xin Tang. Colloidal quantum-dot light emitting diodes with bias-tunable color[J]. Photonics Research, 2022, 10(7): 1633 Copy Citation Text show less
    Pixel arrangement of the conventional display with R/G/B side-by-side pixels and display in this work with color-tunable pixels.
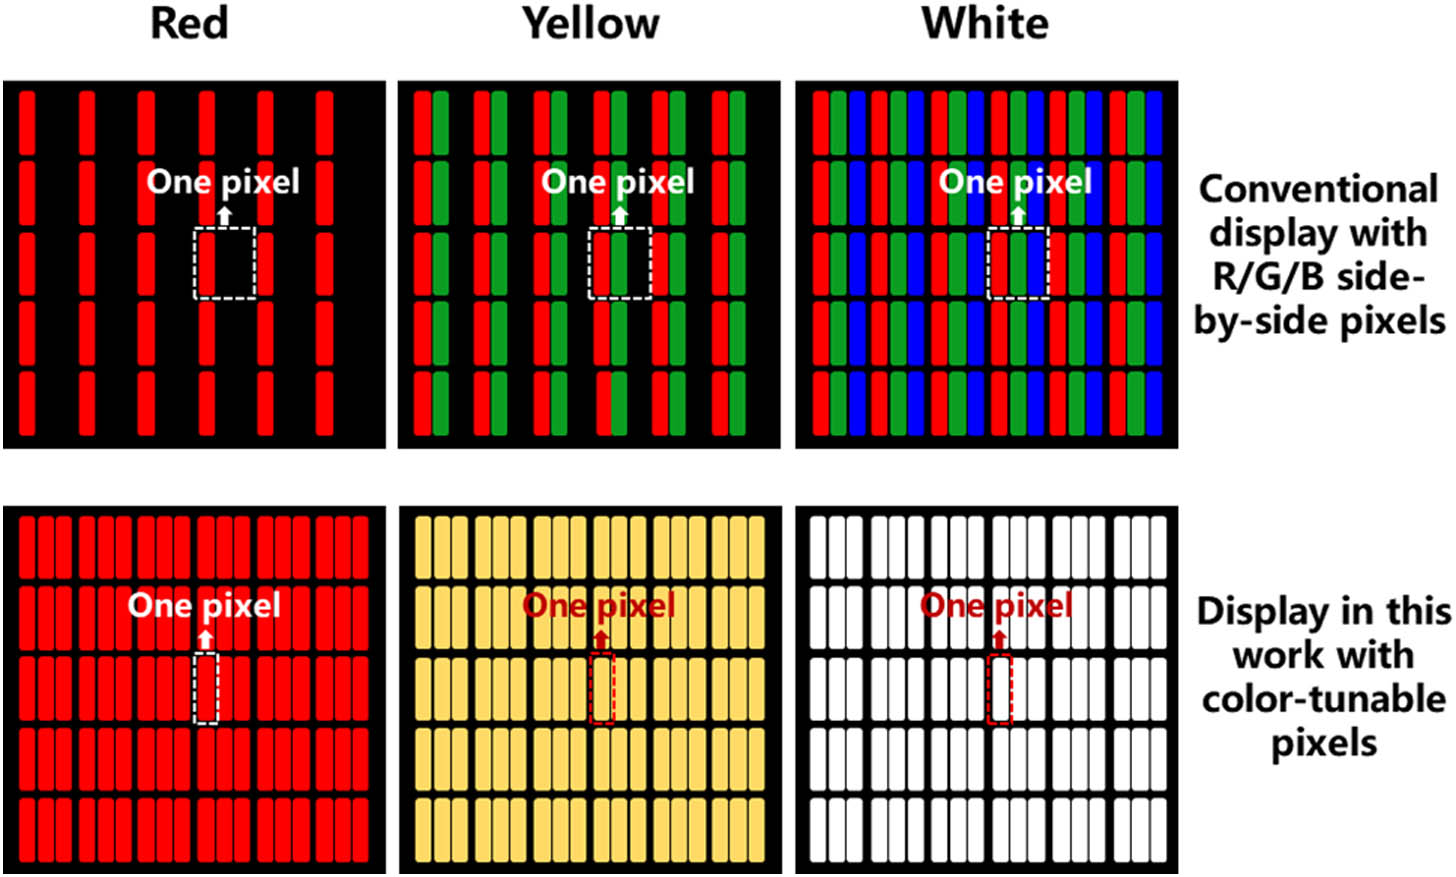
    Fig. 1. Pixel arrangement of the conventional display with R/G/B side-by-side pixels and display in this work with color-tunable pixels.
    Architecture and physics of QLEDs with bias-tunable color. (a) Schematic of the device architecture. (b) Cross-sectional TEM image (I) and EDS compositional mapping images (II–V) of the fabricated QLEDs. (c) Energy band diagram of QLEDs. (d) HR-TEM images of R/G/B QD materials. Absorption spectra and normalized PL spectra of (e) R, (f) G, and (g) B QDs.
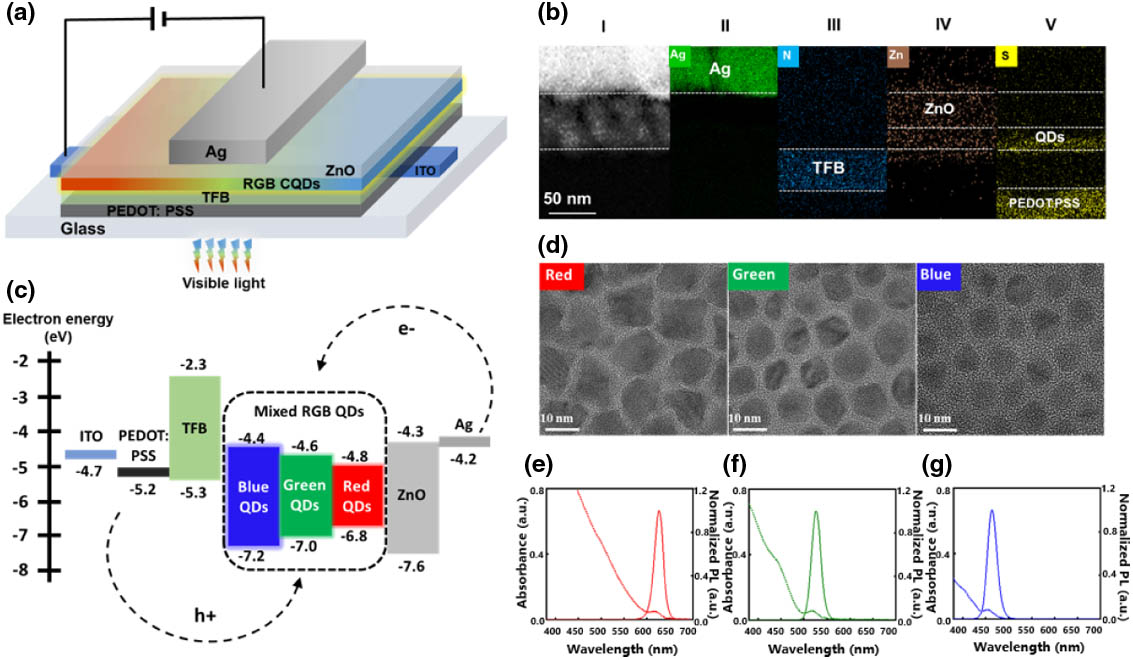
    Fig. 2. Architecture and physics of QLEDs with bias-tunable color. (a) Schematic of the device architecture. (b) Cross-sectional TEM image (I) and EDS compositional mapping images (II–V) of the fabricated QLEDs. (c) Energy band diagram of QLEDs. (d) HR-TEM images of R/G/B QD materials. Absorption spectra and normalized PL spectra of (e) R, (f) G, and (g) B QDs.
    Performance of monochromatic R/G/B QLEDs. (a) CIE 1931 color coordinates of monochromatic R/G/B QLEDs. (b) Voltage-dependent normalized EL spectral evolutions of monochromatic R/G/B QLEDs. (c) Photographs of monochromatic R/G/B QLEDs (emitting area of 0.5 cm×0.5 cm) at applied voltage. (d) Current density versus voltage, (e) luminance versus voltage, and (f) EQE versus current density for monochromatic R/G/B QLEDs.
    Fig. 3. Performance of monochromatic R/G/B QLEDs. (a) CIE 1931 color coordinates of monochromatic R/G/B QLEDs. (b) Voltage-dependent normalized EL spectral evolutions of monochromatic R/G/B QLEDs. (c) Photographs of monochromatic R/G/B QLEDs (emitting area of 0.5  cm×0.5  cm) at applied voltage. (d) Current density versus voltage, (e) luminance versus voltage, and (f) EQE versus current density for monochromatic R/G/B QLEDs.
    Demonstration of QLEDs with bias-tunable color. Normalized PL spectra of mixed R/G/B QDs used for the fabrication of full-color-tunable QLEDs with (a) formulation A, (b) formulation B, and (c) formulation C. Evolution of CIE 1931 color coordinates of (d) formulation A, B, and (e) formulation C-based full-color-tunable QLEDs with increasing bias voltages. Inset of (e): CCT can be adjusted from 1500 to 10,000 K, which well traces the blackbody trajectory. (f) Evolution of CIE 1976 color coordinates of formulation C-based full-color-tunable QLEDs with increasing bias voltages. The asterisk represents the white QLEDs in (e) and (f). (g) Evolution of as-recorded EL spectra of formulation C-based full-color-tunable QLEDs with increasing bias voltages. (h) EL contribution of R/G/B individual color to the entire EL spectra of formulation C-based full-color-tunable QLEDs at different bias voltages. (i) Photographs of formulation C-based full-color-tunable QLEDs (emitting area of 0.5 cm×0.5 cm) at different bias voltages.
    Fig. 4. Demonstration of QLEDs with bias-tunable color. Normalized PL spectra of mixed R/G/B QDs used for the fabrication of full-color-tunable QLEDs with (a) formulation A, (b) formulation B, and (c) formulation C. Evolution of CIE 1931 color coordinates of (d) formulation A, B, and (e) formulation C-based full-color-tunable QLEDs with increasing bias voltages. Inset of (e): CCT can be adjusted from 1500 to 10,000 K, which well traces the blackbody trajectory. (f) Evolution of CIE 1976 color coordinates of formulation C-based full-color-tunable QLEDs with increasing bias voltages. The asterisk represents the white QLEDs in (e) and (f). (g) Evolution of as-recorded EL spectra of formulation C-based full-color-tunable QLEDs with increasing bias voltages. (h) EL contribution of R/G/B individual color to the entire EL spectra of formulation C-based full-color-tunable QLEDs at different bias voltages. (i) Photographs of formulation C-based full-color-tunable QLEDs (emitting area of 0.5  cm×0.5  cm) at different bias voltages.
    Performance of QLEDs with bias-tunable color. (a) Luminance and current density versus bias voltage for full-color-tunable QLEDs. (b) EQE versus bias voltage for full-color-tunable QLEDs. (c) Performance comparison of R/G/B QDs-mixed full-color QLEDs [1,2,4,20,20,28].
    Fig. 5. Performance of QLEDs with bias-tunable color. (a) Luminance and current density versus bias voltage for full-color-tunable QLEDs. (b) EQE versus bias voltage for full-color-tunable QLEDs. (c) Performance comparison of R/G/B QDs-mixed full-color QLEDs [1,2,4,20,20,28].
    Proportion in Mixed R/G/B QDs
    FormulationRed QDs (20  mgmL1)Green QDs (13  mgmL1)Blue QDs (20  mgmL1)
    Formulation A10.40.6
    Formulation B17.16.7
    Formulation C1355
    Table 1. Volume Ratios of Mixed R/G/B QDs Used for Fabrication of Full-Color-Tunable QLEDs
    TypePixel Density and Fill Factor of Full-Color DisplayManufacturing ProcessReferencesTunable Spectral Range (Expressed by CIE 1931)External Quantum Efficiency
    Lateral integration configuration with side-by-side patterning of R/G/B QDsLowPhotolithography approach2020, Nano Res. [13]R (0.69, 0.31); G (0.16, 0.77); B (0.15, 0.07)
    2021, ACS Appl. Mater. Interfaces [14]R 4.5%; G 5.4%; B 4.7%
    Ink-jet2017, Sci. China Chem [15]R (0.68, 0.31); G (0.20, 0.74); B (0.14, 0.05)R 2.24%; G 3.31%; B 0.60%
    Contact printing2008, Nano Lett. [17]R (0.66, 0.34); G (0.21, 0.70); B (0.18, 0.13)R 1.0%; G 0.5%; B 0.2%
    Vertical integration configurationHighLayer-by-layer stacked R/G/B QDs films2019, Adv. Funct. Mater. [23]From (0.1174, 0.7679) to (0.1454, 0.0464)
    2010, Nano Lett. [24]Red, orange, yellow-green, and green0.3%
    Tandem-structure R/G/B QLEDs2017, J. SID [25]White (0.30, 0.44)2.04%
    Mixed R, G, and B QDs as light emitting layersHighCombination of white QLEDs and color filters2017, ACS Appl. Mater. Interfaces [1]0.37%
    2015, Nanoscale [2](0.504, 0.449) at 6.5 V; (0.482, 0.438) at 9 V or (0.330, 0.253) at 7 V; (0.405, 0.348) at 9.5 V0.3%–0.6%
    2015, ACS Nano [4](0.310, 0.229) at 5 V; (0.195, 0.172) at 9 V10.9%
    2014, Adv. Mater. [20](0.33, 0.35)1%
    2018, Nano Res. [28]0.65%
    2011, Nano Lett. [20](0.336, 0.339)0.033%
    Full-color-tunable QLEDsThis workFrom red (0.649, 0.330) to orange (0.453, 0.389) to yellow (0.350,0.347) to green (0.283, 0.305) to blue (0.255,0.264)13.3%
    Table 2. Comparison of Full-Color QLEDs
    Ge Mu, Tianyu Rao, Menglu Chen, Yimei Tan, Qun Hao, Xin Tang. Colloidal quantum-dot light emitting diodes with bias-tunable color[J]. Photonics Research, 2022, 10(7): 1633
    Download Citation