• Photonics Research
  • Vol. 10, Issue 9, 2140 (2022)
Linpeng Yu1、†, Jinhui Liang1、†, Shiting Huang1, Jinzhang Wang1, Jiachen Wang1, Xing Luo1, Peiguang Yan1, Fanlong Dong1、2, Xing Liu2, Qitao Lue3, Chunyu Guo1、*, and Shuangchen Ruan1、2、4
Author Affiliations
  • 1Shenzhen Key Laboratory of Laser Engineering, Guangdong Provincial Key Laboratory of Micro/Nano Optomechatronics Engineering, Key Laboratory of Optoelectronic Devices and Systems of Ministry of Education and Guangdong Province, College of Physics and Optoelectronic Engineering, Shenzhen Universityhttps://ror.org/01vy4gh70, Shenzhen 518060, China
  • 2Key Laboratory of Advanced Optical Precision Manufacturing Technology of Guangdong Higher Education Institutes, Shenzhen Technology University, Shenzhen 518118, China
  • 3Han’s Laser Technology Industry Group Co., Ltd., Shenzhen 518057, China
  • 4e-mail: scruan@sztu.edu.cn
  • show less
    DOI: 10.1364/PRJ.463613 Cite this Article Set citation alerts
    Linpeng Yu, Jinhui Liang, Shiting Huang, Jinzhang Wang, Jiachen Wang, Xing Luo, Peiguang Yan, Fanlong Dong, Xing Liu, Qitao Lue, Chunyu Guo, Shuangchen Ruan. Generation of single solitons tunable from 3 to 3.8 μm in cascaded Er3+-doped and Dy3+-doped fluoride fiber amplifiers[J]. Photonics Research, 2022, 10(9): 2140 Copy Citation Text show less
    Schematic diagram of the laser system. DM, dichroic mirror; ISO, isolator; PBS, polarization beam splitter; LD, laser diode; λ/2, half-wave plate; λ/4, quarter-wave plate; L, lens; GM, gold mirror; CMS, cladding mode stripper.
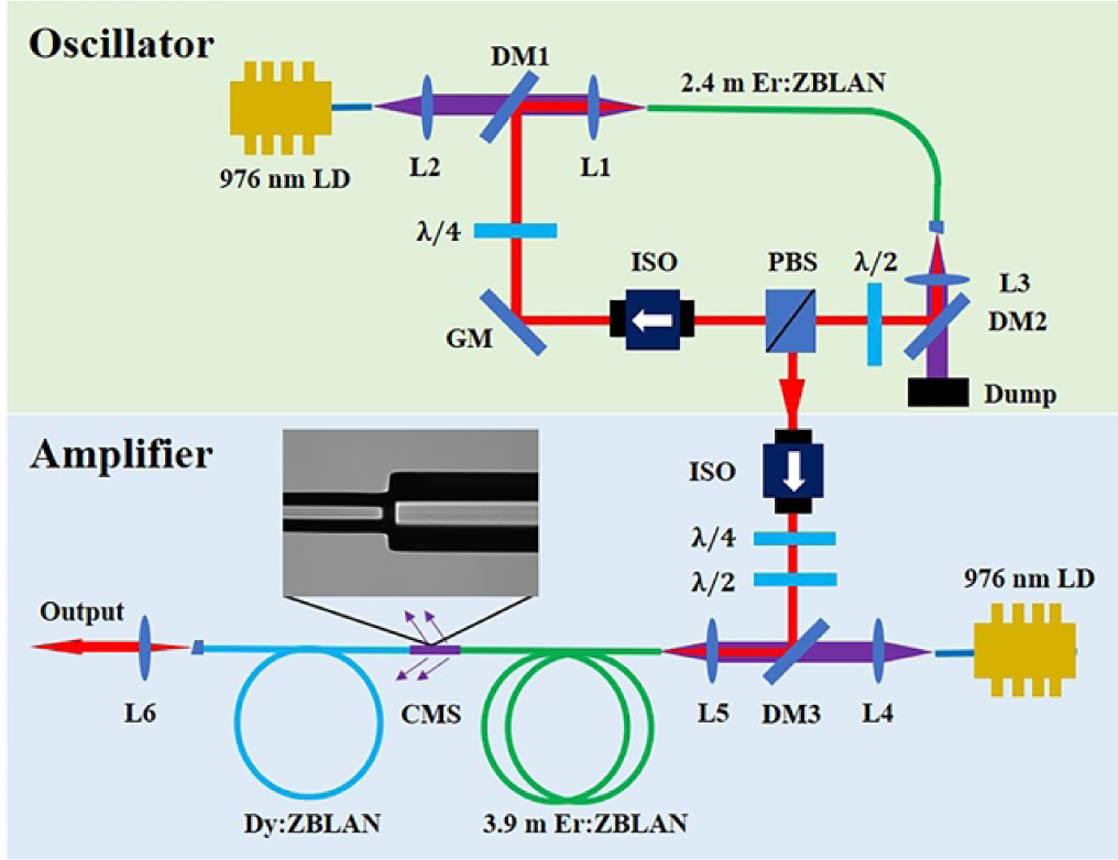
    Fig. 1. Schematic diagram of the laser system. DM, dichroic mirror; ISO, isolator; PBS, polarization beam splitter; LD, laser diode; λ/2, half-wave plate; λ/4, quarter-wave plate; L, lens; GM, gold mirror; CMS, cladding mode stripper.
    (a) Output spectrum (black line) fitted with an ideal sech-shaped profile (red line), (b) autocorrelation trace fitted by a sech2 profile, (c) RF spectrum with a resolution bandwidth of 10 Hz, (d) oscilloscope trains of the mode-locked pulses.
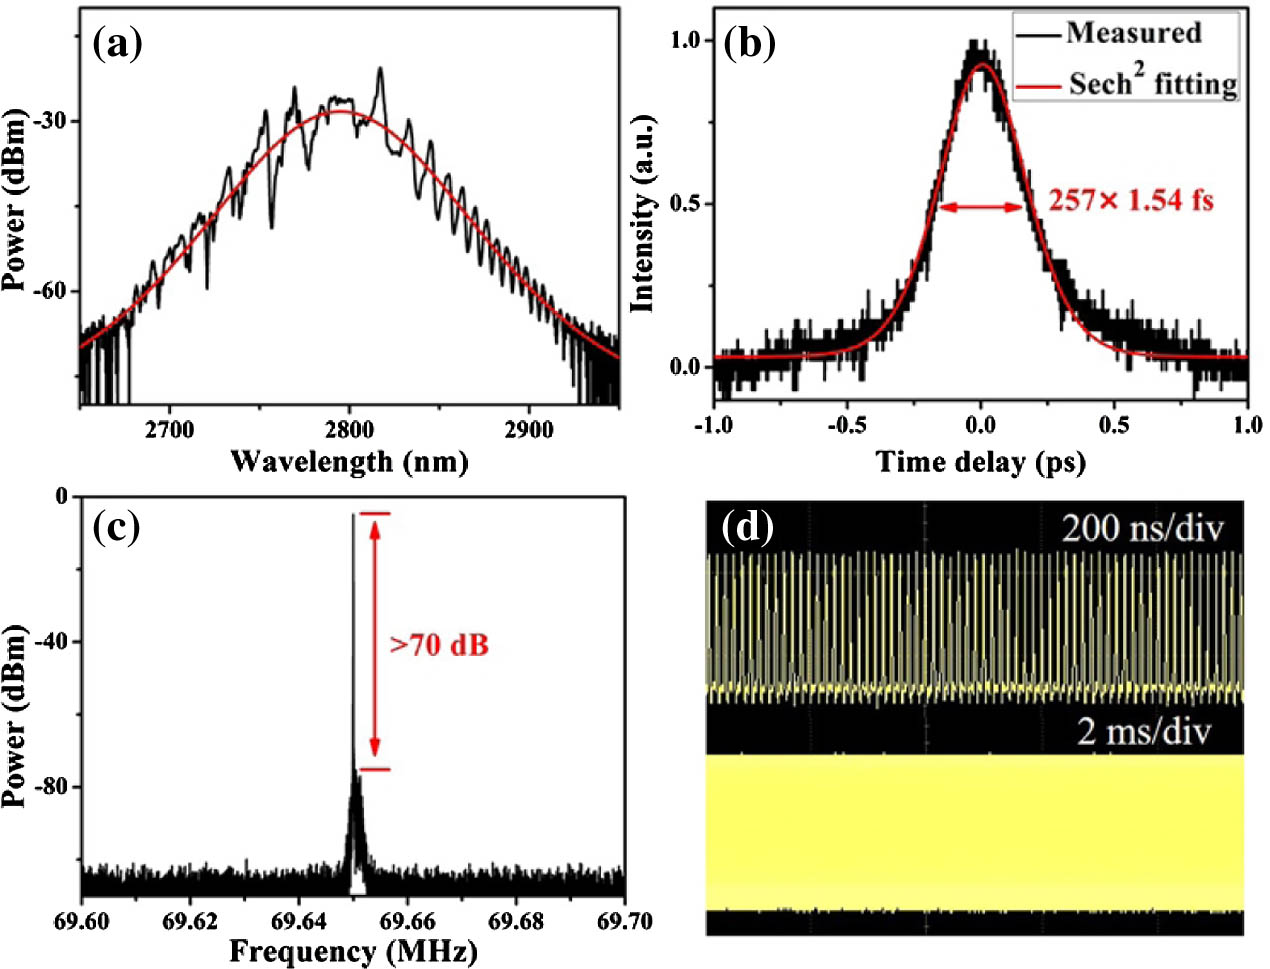
    Fig. 2. (a) Output spectrum (black line) fitted with an ideal sech-shaped profile (red line), (b) autocorrelation trace fitted by a sech2 profile, (c) RF spectrum with a resolution bandwidth of 10 Hz, (d) oscilloscope trains of the mode-locked pulses.
    (a) Measured output spectra under different pump powers. (b) Average power and central wavelength of Raman solitons, and total output average power versus pump power.
    Fig. 3. (a) Measured output spectra under different pump powers. (b) Average power and central wavelength of Raman solitons, and total output average power versus pump power.
    (a) The spectral evolution under different 976 nm pump powers in the 1.2 m long Dy3+-doped fluoride fiber amplifier. The spectra were fitted with an ideal sech-shaped profile (dashed line). The calculated pulse energy of the Raman soliton is indicated for each spectrum. (b) The measured pulse duration and average power versus 976 nm pump power. (c) The input and output pulse energy, and the corresponding in-band amplification efficiency under different 976 nm pump powers.
    Fig. 4. (a) The spectral evolution under different 976 nm pump powers in the 1.2 m long Dy3+-doped fluoride fiber amplifier. The spectra were fitted with an ideal sech-shaped profile (dashed line). The calculated pulse energy of the Raman soliton is indicated for each spectrum. (b) The measured pulse duration and average power versus 976 nm pump power. (c) The input and output pulse energy, and the corresponding in-band amplification efficiency under different 976 nm pump powers.
    (a) Measured output spectra under different pump powers in the 11 m long Dy3+-doped fluoride fiber amplifier. The spectra were fitted with an ideal sech-shaped profile (dashed line). (b) Average power and pulse duration of Raman solitons versus pump power.
    Fig. 5. (a) Measured output spectra under different pump powers in the 11 m long Dy3+-doped fluoride fiber amplifier. The spectra were fitted with an ideal sech-shaped profile (dashed line). (b) Average power and pulse duration of Raman solitons versus pump power.
    Wavelength tunability and output characteristics of the 11 m long Dy3+-doped fluoride fiber amplifier under a pump power of 20 W. (a) Pulse energy and pulse duration versus Raman-soliton central wavelength. (b) Typical tuning spectra.
    Fig. 6. Wavelength tunability and output characteristics of the 11 m long Dy3+-doped fluoride fiber amplifier under a pump power of 20 W. (a) Pulse energy and pulse duration versus Raman-soliton central wavelength. (b) Typical tuning spectra.
    SHG-FROG measurements of the Raman soliton at 3.8 μm from the 11 m long Dy3+-doped fluoride fiber amplifier. (a) Measured and (b) retrieved SHG-FROG traces. (c) Retrieved spectrum (black) and phase (blue) from the SHG-FROG trace and measured spectrum (red) using the OSA205C. (d) Retrieved temporal intensity (black) and phase (blue).
    Fig. 7. SHG-FROG measurements of the Raman soliton at 3.8 μm from the 11 m long Dy3+-doped fluoride fiber amplifier. (a) Measured and (b) retrieved SHG-FROG traces. (c) Retrieved spectrum (black) and phase (blue) from the SHG-FROG trace and measured spectrum (red) using the OSA205C. (d) Retrieved temporal intensity (black) and phase (blue).
    Stability test of the Raman soliton at 3.8 μm. (a) RF spectrum with a resolution bandwidth of 10 Hz. (b) Output power fluctuation near 1.6 W during 30 min. Inset: oscilloscope trains.
    Fig. 8. Stability test of the Raman soliton at 3.8 μm. (a) RF spectrum with a resolution bandwidth of 10 Hz. (b) Output power fluctuation near 1.6 W during 30 min. Inset: oscilloscope trains.
    SSB RIN traces and integrated RMS RINs of (a) the seed oscillator and (b) the fiber amplifier.
    Fig. 9. SSB RIN traces and integrated RMS RINs of (a) the seed oscillator and (b) the fiber amplifier.
    Linpeng Yu, Jinhui Liang, Shiting Huang, Jinzhang Wang, Jiachen Wang, Xing Luo, Peiguang Yan, Fanlong Dong, Xing Liu, Qitao Lue, Chunyu Guo, Shuangchen Ruan. Generation of single solitons tunable from 3 to 3.8 μm in cascaded Er3+-doped and Dy3+-doped fluoride fiber amplifiers[J]. Photonics Research, 2022, 10(9): 2140
    Download Citation