• Laser & Optoelectronics Progress
  • Vol. 58, Issue 17, 1716002 (2021)
Xianglin Zhan** and Limingheng Sun*
Author Affiliations
  • College of Electronic Information and Automation, Civil Aviation University of China, Tianjin 300300, China
  • show less
    DOI: 10.3788/LOP202158.1716002 Cite this Article Set citation alerts
    Xianglin Zhan, Limingheng Sun. Detection of Crack Parameters of Aluminum Plates Based on Nonlinear Ultrasonic[J]. Laser & Optoelectronics Progress, 2021, 58(17): 1716002 Copy Citation Text show less
    Lamb wave dispersion curves. (a) Phase velocity curves; (b) group velocity curves
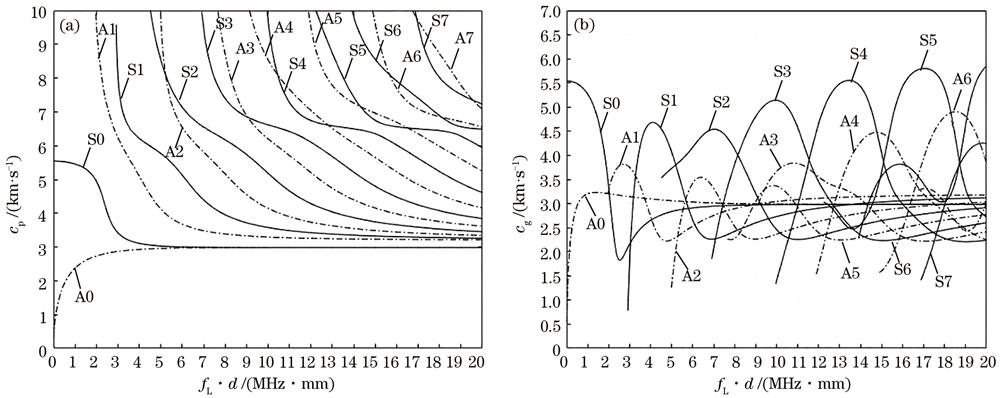
    Fig. 1. Lamb wave dispersion curves. (a) Phase velocity curves; (b) group velocity curves
    Finite element model
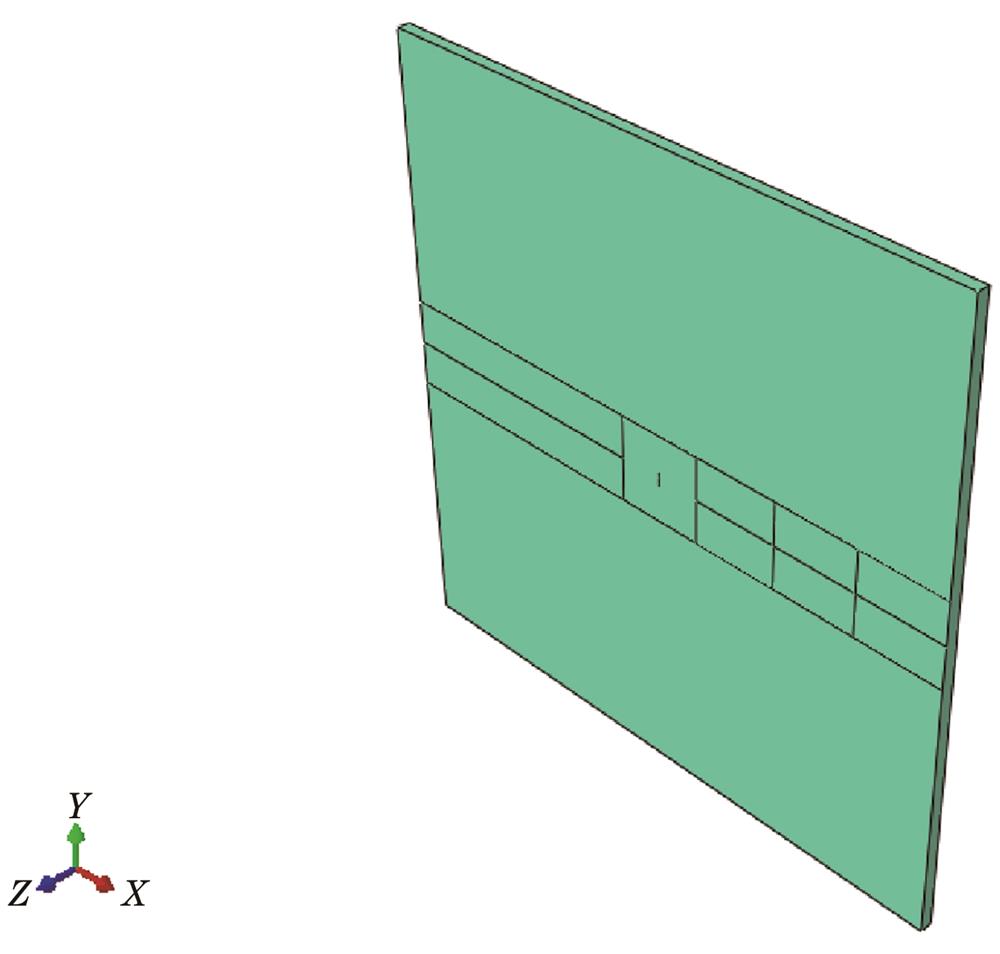
    Fig. 2. Finite element model
    Comparison chart of received signals for non-destructive and damaged plates
    Fig. 3. Comparison chart of received signals for non-destructive and damaged plates
    Signal frequency domain diagrams. (a) Non-destructive plate spectrogram; (b) spectrogram of damaged plate
    Fig. 4. Signal frequency domain diagrams. (a) Non-destructive plate spectrogram; (b) spectrogram of damaged plate
    Received signal time-frequency domain diagrams. (a) Time-frequency domain diagram of non-destructive plate; (b) time-frequency domain diagram of damaged plate
    Fig. 5. Received signal time-frequency domain diagrams. (a) Time-frequency domain diagram of non-destructive plate; (b) time-frequency domain diagram of damaged plate
    β fitting curve with crack length
    Fig. 6. β fitting curve with crack length
    β fitting curve with crack width
    Fig. 7. β fitting curve with crack width
    Crack simulation comparison. (a) Straight crack simulation cloud map; (b) 45° crack simulation cloud map
    Fig. 8. Crack simulation comparison. (a) Straight crack simulation cloud map; (b) 45° crack simulation cloud map
    Simulation diagram
    Fig. 9. Simulation diagram
    Harmonic signal comparison. (a) p2 probe extraction signal comparison at 0° and 15°; (b) p1 probe extraction signal comparison at 0° and 15°; (c) p3 probe extraction signal comparison at 0° and 15°; (d) comparison of signals extracted from three receiving points at 15°
    Fig. 10. Harmonic signal comparison. (a) p2 probe extraction signal comparison at 0° and 15°; (b) p1 probe extraction signal comparison at 0° and 15°; (c) p3 probe extraction signal comparison at 0° and 15°; (d) comparison of signals extracted from three receiving points at 15°
    β fitting curves of p1, p2 and p3 probes extraction signals
    Fig. 11. β fitting curves of p1, p2 and p3 probes extraction signals
    Parameterβ1β2β3
    Error /%1.6155.2274.084
    Calculated value0.17340.11560.1053
    Simulation value0.17620.10950.1096
    Table 1. Test results at 17°
    Parameterβ1β2β3
    Error /%1.6362.4694.115
    Calculated value0.11000.11340.1045
    Simulation value0.10820.11620.1088
    Table 2. Test results at 58°
    Xianglin Zhan, Limingheng Sun. Detection of Crack Parameters of Aluminum Plates Based on Nonlinear Ultrasonic[J]. Laser & Optoelectronics Progress, 2021, 58(17): 1716002
    Download Citation