• Spectroscopy and Spectral Analysis
  • Vol. 42, Issue 11, 3588 (2022)
Xing-zhong HUANG*, Wen-fen WU1;, Zhan-bing LI1;, Hui-quan LI1; 2;, Qing-qing LIU1;, and Shao-peng LI1; *;
Author Affiliations
  • 1. CAS Key Laboratory of Green Process and Engineering, National Engineering Research Center of Green Recycling for Strategic Metal Resources, Institute of Process Engineering, Chinese Academy of Sciences, Beijing 100190, China
  • show less
    DOI: 10.3964/j.issn.1000-0593(2022)11-3588-07 Cite this Article
    Xing-zhong HUANG, Wen-fen WU, Zhan-bing LI, Hui-quan LI, Qing-qing LIU, Shao-peng LI. Spectral Analysis of Fluoride and Nitride Phase in Secondary Aluminum Dross[J]. Spectroscopy and Spectral Analysis, 2022, 42(11): 3588 Copy Citation Text show less
    The comparison of different SAD samples: (a) XRD pattern; (b)quantitative analysis
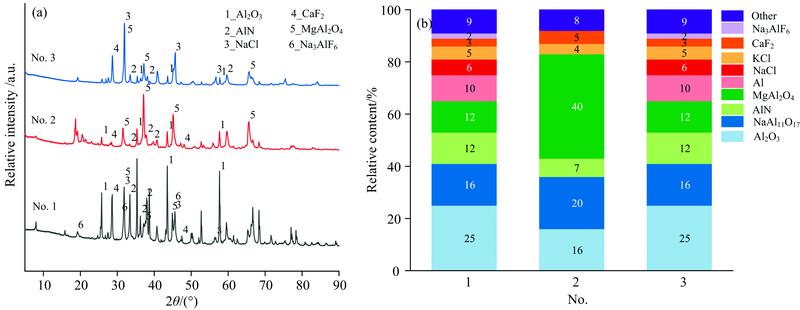
    Fig. 1. The comparison of different SAD samples: (a) XRD pattern; (b)quantitative analysis
    Wide-scan XPS survey spectra of different SAD samples(a): No.1 sample; (b): No.2 sample; (c): No.3 sample
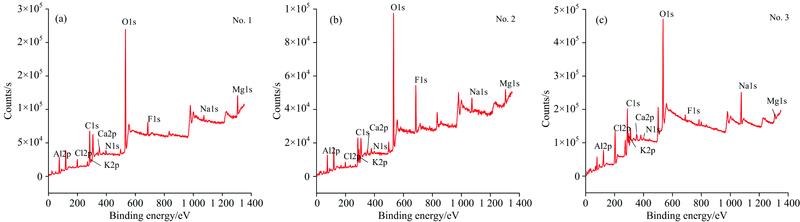
    Fig. 2. Wide-scan XPS survey spectra of different SAD samples
    (a): No.1 sample; (b): No.2 sample; (c): No.3 sample
    High resolution XPS spectra of Al(2p)/N(1s)/F(1s) of different SAD samples
    Fig. 3. High resolution XPS spectra of Al(2p)/N(1s)/F(1s) of different SAD samples
    SEM and elements distribution images of fluoride particle in different SAD samples
    Fig. 4. SEM and elements distribution images of fluoride particle in different SAD samples
    SEM and elements distribution images of nitride particle in different SAD samples
    Fig. 5. SEM and elements distribution images of nitride particle in different SAD samples
    SamplesOAlMgNaKSiCaClFN
    No.141.4238.702.913.482.001.650.855.722.025.48
    No.244.0540.427.521.121.411.250.930.182.294.22
    No.331.8724.044.7011.564.440.901.2718.811.044.30
    Table 1. The chemical composition of different SAD samples (Wt%)
    No.总氟
    含量/%
    表面氟
    含量/%
    结合能
    /eV
    可能存在
    物相
    特征峰
    面积
    相对
    含量/%
    12.024.61683.77NaF343.555.14
    684.71CaF21 319.4320.56
    685.73MgF21 769.2527.57
    686.86Na3AlF63 011.6846.73
    22.2910.19684.62CaF25 025.2575.19
    685.75MgF21 637.2824.81
    31.043.09682.71KF3 585.3826.47
    684.7CaF29 857.6373.53
    Table 2. Binding energy and corresponding phase for F(1s) peaks of different SAD samples
    No.总氮
    含量/%
    表面氮
    含量/%
    结合能
    /eV
    可能存在
    物相
    特征峰
    面积
    相对
    含量/%
    15.483.69396.66AlN1 540.5968.49
    398.94SiNx705.5231.51
    24.221.53396.58AlN266.4959.52
    399.53SiNx181.0040.48
    34.303.05394.72AlN5 476.91100.00
    Table 3. Binding energy and corresponding phase for N(1s) peaks of different SAD samples
    Xing-zhong HUANG, Wen-fen WU, Zhan-bing LI, Hui-quan LI, Qing-qing LIU, Shao-peng LI. Spectral Analysis of Fluoride and Nitride Phase in Secondary Aluminum Dross[J]. Spectroscopy and Spectral Analysis, 2022, 42(11): 3588
    Download Citation