
Guan Yuanhong, Wang Wenjun, Lu Qifeng, Bao Yansong, Zheng Tingwen. Linear Retrieval of Microwave Land Surface Emissivity over the Desert Area in January[J]. Laser & Optoelectronics Progress, 2020, 57(21): 212801
- Laser & Optoelectronics Progress
- Vol. 57, Issue 21, 212801 (2020)
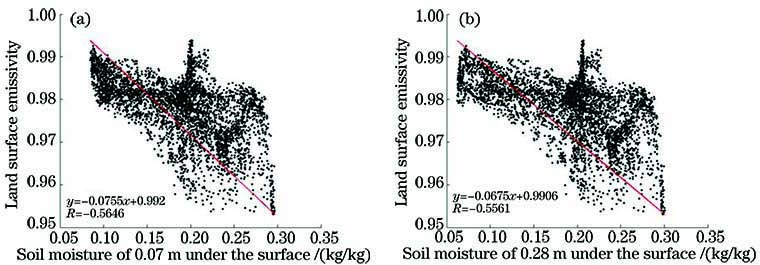
Fig. 1. Scatterplots of Taklimakan Desert in January 24. (a) Scatterplots of land surface emissivity and soil moisture of 0.07 m under the surface; (b) scatterplots of land surface emissivity and soil moisture of 0.28 m under the surface
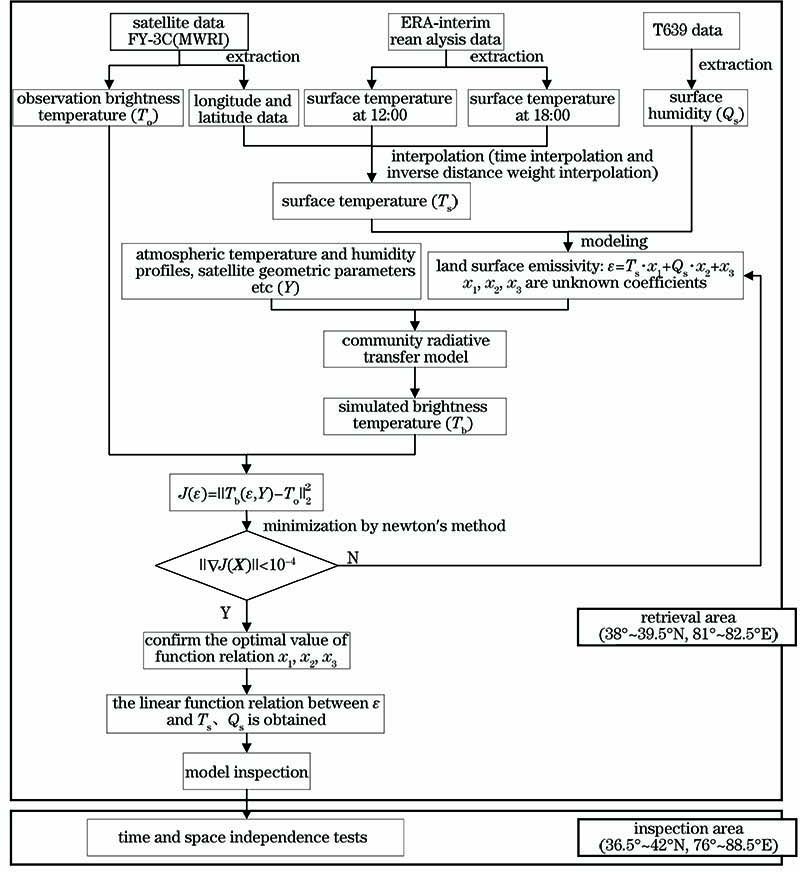
Fig. 2. Technology road map
Fig. 3. Distribution of Taklimakan Desert
Fig. 4. Objective function value of linear retrieval model with 2 factors and 4 factors changes with the number of iterations
Fig. 5. Brightness temperature box-plot of retrieval area in January
Fig. 6. Spatial distribution of observed brightness temperature and simulated brightness temperatures at three different land surface emissivities in Taklimakan Desert area in January 18. (a)Tobs; (b)Told; (c)T2v; (d)T4v
Fig. 7. Deviation spatial distribution of observed brightness temperature and simulated brightness temperature at three different land surface emissivities in Taklimakan Desert area in January 18. (a) Tobs-Told; (b) Tobs-T2v; (c) Tobs-T4v
Fig. 8. Spatial distribution of observed brightness temperature and simulated brightness temperatures at three different land surface emissivities in Taklimakan Desert area in January 29. (a) Tobs; (b) Told; (c) T2v; (d) T4v
Fig. 9. Deviation spatial distribution of observed brightness temperature and simulated brightness temperature at three different land surface emissivities in Taklimakan Desert area in January 29. (a) Tobs-Told; (b) Tobs-T2v; (c) Tobs-T4v
| |||||||||||||||||||||||||||||||||||||||||||||||||||||||||||||||||||||||||||||
Table 1. Microwave imager data and channel characteristics
|
Table 2. Statistics of non-clear sky scanning points for 5-day in retrieval area in January
| |||||||||||||||||||||||||||
Table 3. Average deviation and deviation standard deviation of linear retrieval model with 2 factors and 4 factors in January

Set citation alerts for the article
Please enter your email address
© Copyright 2018-2021 | Chinese Laser Press. All Rights Reserved 沪ICP备15018463号-20