
Yi-yi Li, Hao-chun Zhang. Establishment and evaluation of a co-effect structure with thermal concentration–rotation function in transient regime[J]. Chinese Physics B, 2020, 29(8):
- Chinese Physics B
- Vol. 29, Issue 8, (2020)
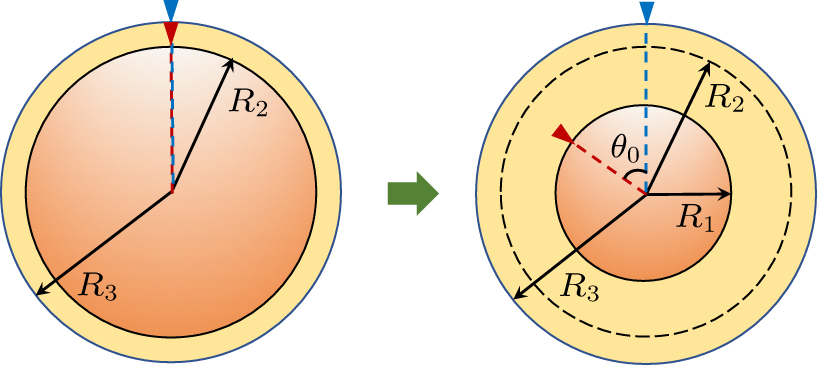
Fig. 1. Diagram of spatial transformation process.
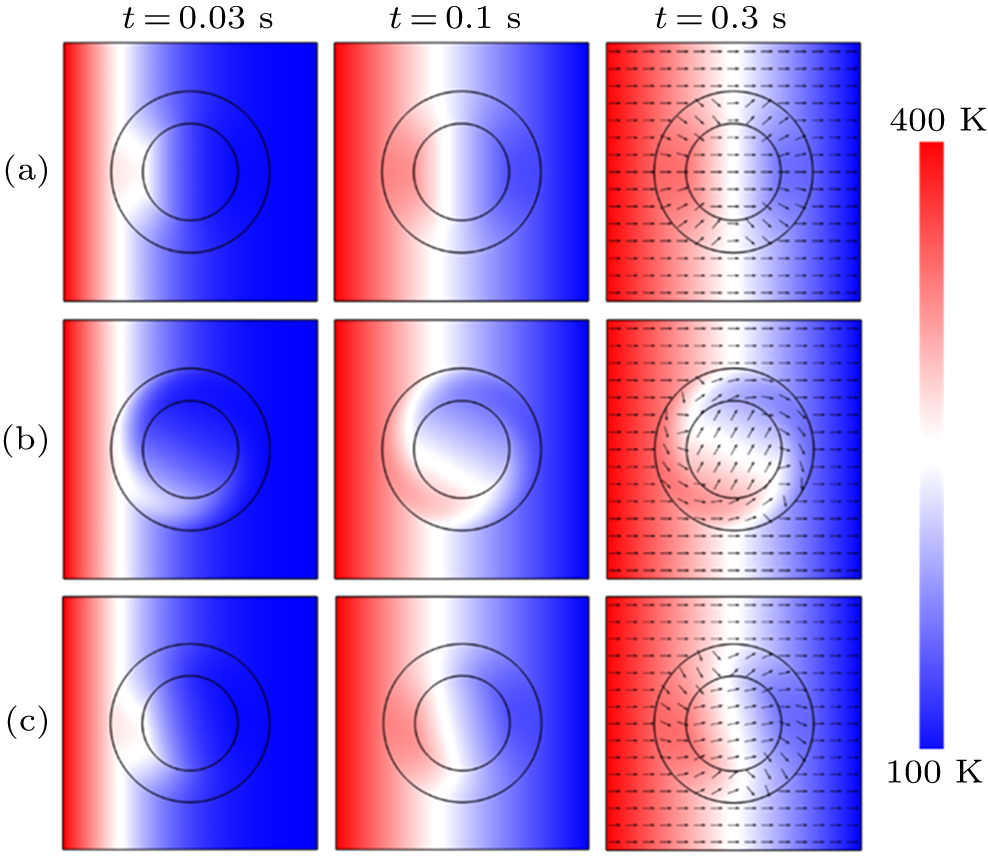
Fig. 2. Transient temperature profiles of three structures at different times: (a) single concentrator, (b) single rotator, (c) co-effect structure, the black arrows represent heat flux. The dimension of the whole simulation domain is 0.8 cm × 0.8 cm, both upper and lower boundaries are thermally isolated, left and right boundaries are respectively fixed at temperature T = 400 K and T = 100 K, leading to an applied temperature gradient of 375 K/cm. The medium of background area outside the function region is set with θ 0 = 0.16 W/(m⋅K) and ρc = 1.358 × 10⁻³ MJ/(m3⋅K) and thermal conductivity of the transformed domain are arranged as theoretical work. The geometric parameters of annuls region are set as R 1 = 0.15 cm, R 2 = 0.23 cm, and R 3 = 0.25 cm.
Fig. 3. (a) Diagram of measured line, (b) temperature distribution on the measured line along y direction of three structures.
Fig. 4. Profiles of components of the transformed local entropy production rate at t = 0.3 s in three structures: (a1) and (a2) single concentrator; (b1) and (b2) single rotator; (c1) and (c2) co-effect structure.
Fig. 5. Variations of different constitutes of anisotropic thermal conductivity in annuls from inner boundary to outer boundary of three structures: (a) κ x x ′ κ x y ′ ( κ y x ′ ) κ y y ′
Fig. 6. Variations of the transformed total entropy generation S ˙ g R 3 = 0.25 cm: (a) R 2 = 0.23 cm, θ 0 = π /3, (b) R 1 = 0.09 cm, θ 0 = π /3, (c) R 1 = 0.15 cm, R 2 = 0.23 cm.

Set citation alerts for the article
Please enter your email address
© Copyright 2018-2021 | Chinese Laser Press. All Rights Reserved 沪ICP备15018463号-20