• Photonics Research
  • Vol. 10, Issue 11, B23 (2022)
Zhizhang Wang1、†, Wange Song1、†, Yuxin Chen, Bin Fang, Jitao Ji, Haoran Xin, Shining Zhu, and Tao Li*
Author Affiliations
  • National Laboratory of Solid State Microstructures, Key Laboratory of Intelligent Optical Sensing and Manipulations, Jiangsu Key Laboratory of Artificial Functional Materials, College of Engineering and Applied Sciences, Nanjing University, Nanjing 210093, China
  • show less
    DOI: 10.1364/PRJ.463118 Cite this Article Set citation alerts
    Zhizhang Wang, Wange Song, Yuxin Chen, Bin Fang, Jitao Ji, Haoran Xin, Shining Zhu, Tao Li. Metasurface empowered lithium niobate optical phased array with an enlarged field of view[J]. Photonics Research, 2022, 10(11): B23 Copy Citation Text show less
    Design of the metasurface-based POPA on LNOI platform. (a) Scheme of the metasurface-based POPA device for 2D optical beam steering. The output beam can be steered in two dimensions (represented in orange and green). (b) Top and (c) cross-sectional views of the non-uniformly arranged waveguide array without metasurface. (d) Coupling coefficient and coupling length as a function of the gap of waveguides. (e) Simulated coupling coefficient designed and gap distributions for different waveguides. (f) Ey profile input into N0 and N−4 waveguides by coupled-mode theory (CMT) calculated in 1D lithium niobate waveguide arrays.
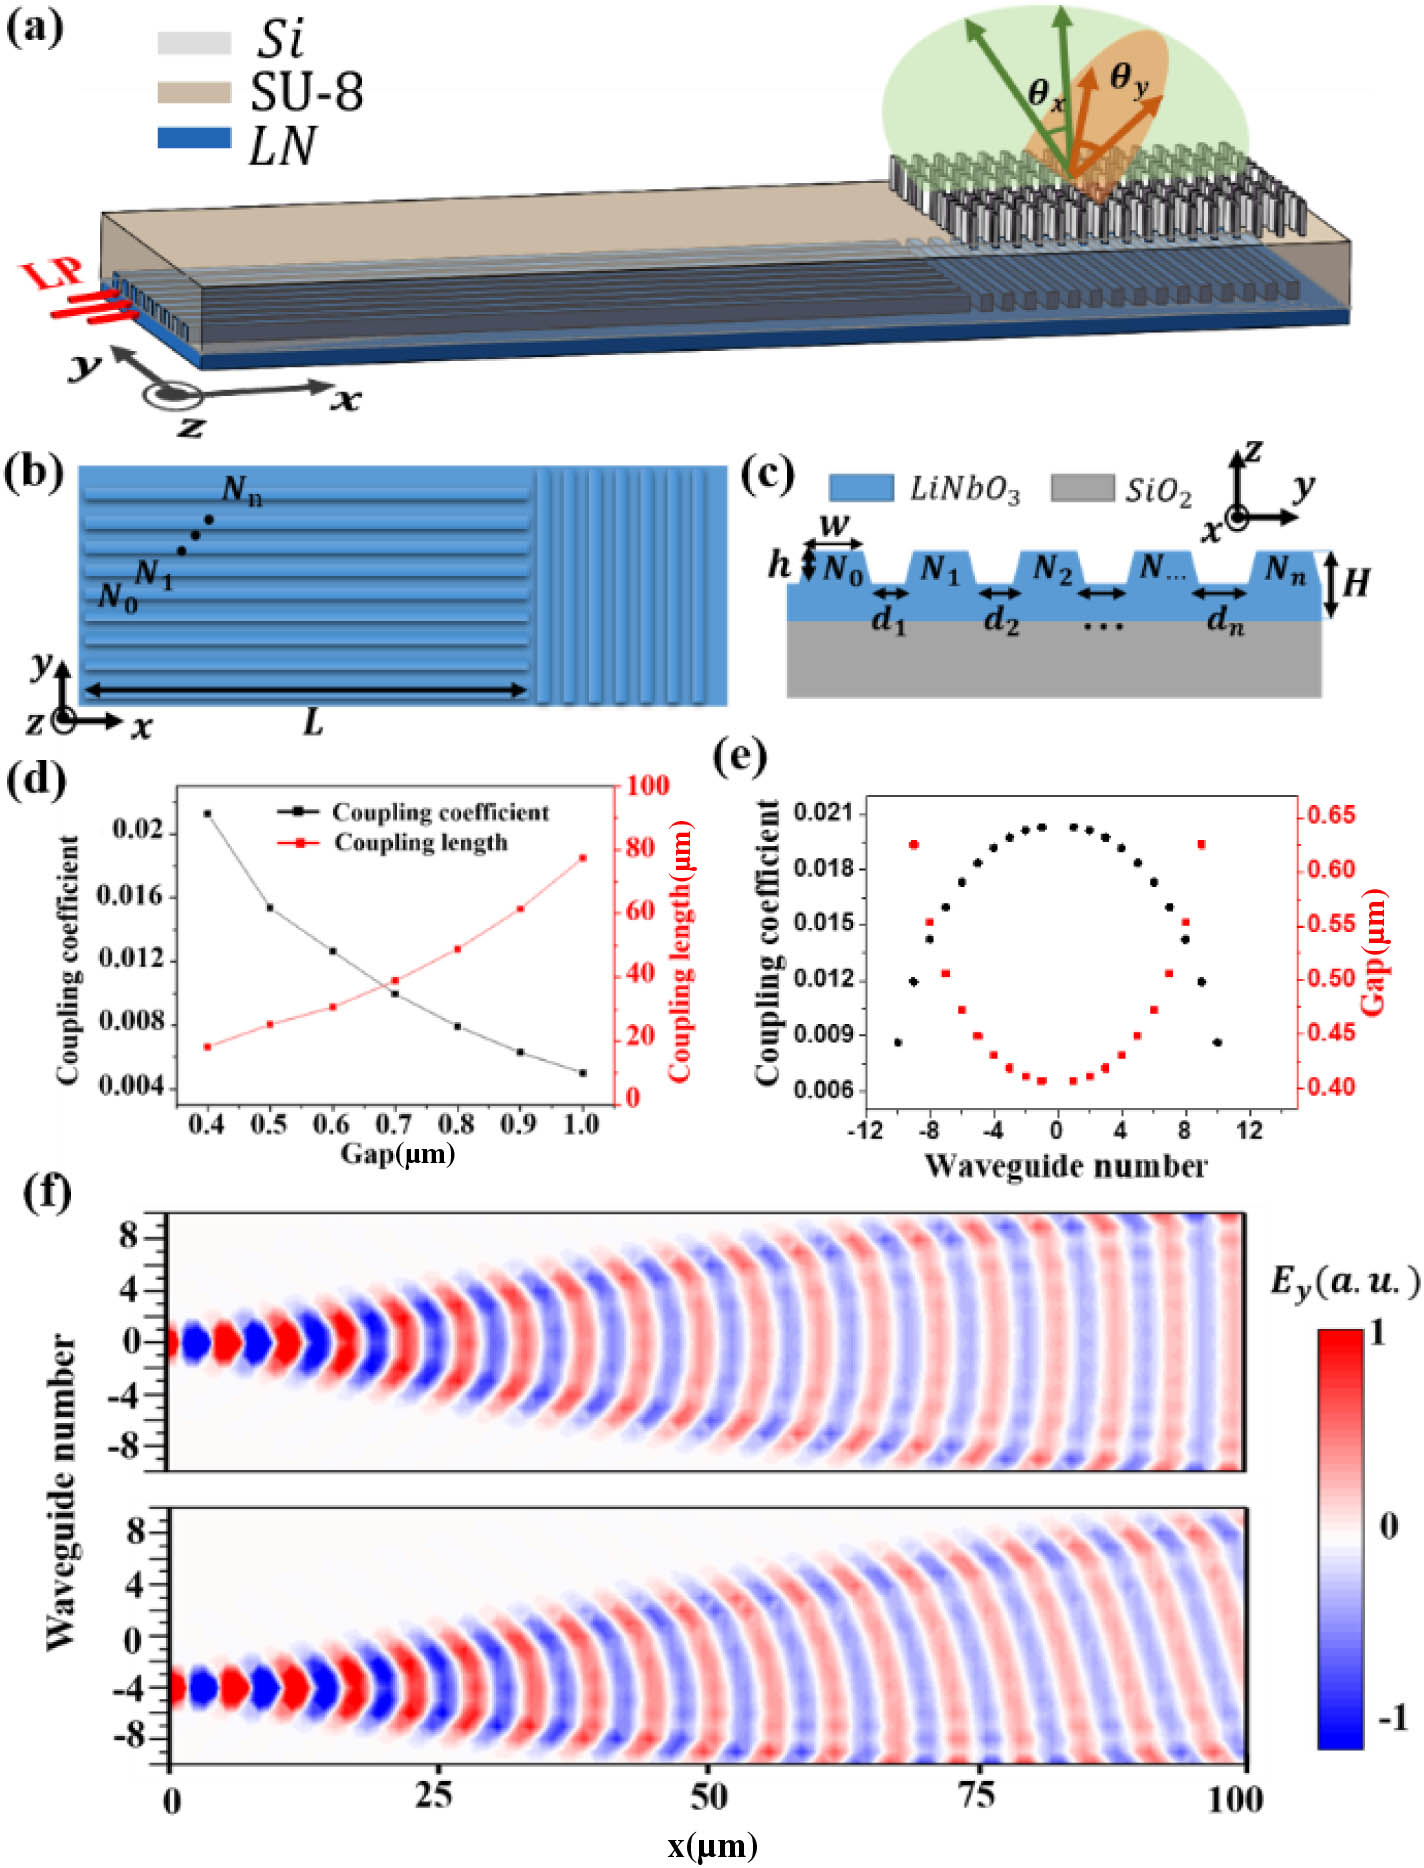
    Fig. 1. Design of the metasurface-based POPA on LNOI platform. (a) Scheme of the metasurface-based POPA device for 2D optical beam steering. The output beam can be steered in two dimensions (represented in orange and green). (b) Top and (c) cross-sectional views of the non-uniformly arranged waveguide array without metasurface. (d) Coupling coefficient and coupling length as a function of the gap of waveguides. (e) Simulated coupling coefficient designed and gap distributions for different waveguides. (f) Ey profile input into N0 and N4 waveguides by coupled-mode theory (CMT) calculated in 1D lithium niobate waveguide arrays.
    (a) Simulated electrical field distribution for light propagation in waveguide array and emitting antenna region. (b) Ey profile of the 40 μm×24 μm emitting antenna region at z=0.4 μm. (c) Ey profile of yz plane at x=105 μm for light emitting from grating incidence to space.
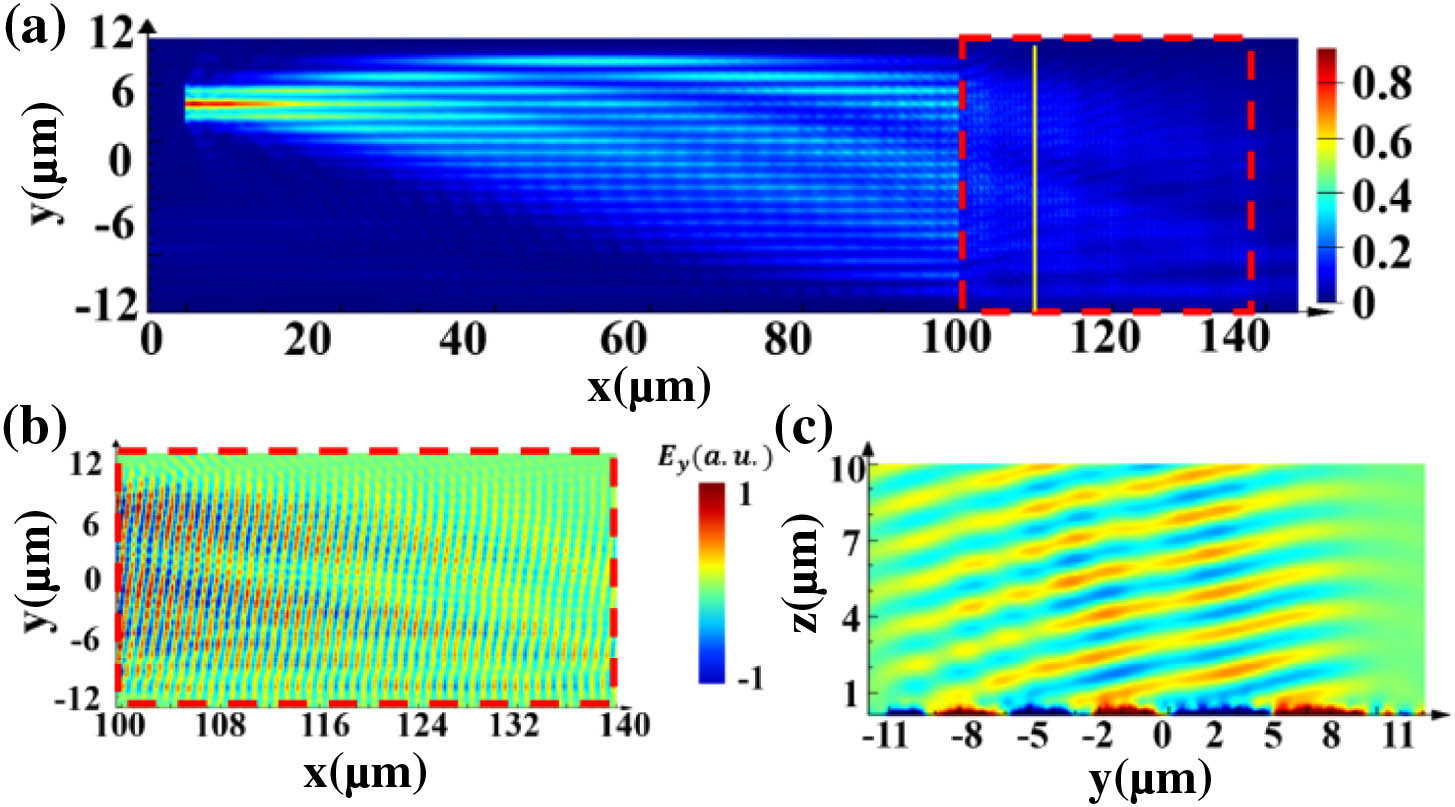
    Fig. 2. (a) Simulated electrical field distribution for light propagation in waveguide array and emitting antenna region. (b) Ey profile of the 40  μm×24  μm emitting antenna region at z=0.4  μm. (c) Ey profile of yz plane at x=105  μm for light emitting from grating incidence to space.
    Experiments of POPA on LNOI and beam steering results. (a) Scanning electron microscopy (SEM) image and zoom-in regions of the POPA sample. The sample consists of an array of 41 waveguides, 12 grating couplers connected to the array, and the radiating grating. Top right inset shows the 1×3 splitter. Bottom right inset shows the distribution of waveguides in the array. (b) Measured far-field intensity pattern of the POPA with an FWHM beam size of 2.74°×3.76° and corresponding far-field image captured by the near-infrared camera at port -2. Right inset shows the full 2D far-field image of the beam spot. (c) Measured optical power versus angle at different angles in θy direction, showing a ±21.27° viewing angle (marked with different colors); right inset shows composition of far-field patterns from 12-port switching.
    Fig. 3. Experiments of POPA on LNOI and beam steering results. (a) Scanning electron microscopy (SEM) image and zoom-in regions of the POPA sample. The sample consists of an array of 41 waveguides, 12 grating couplers connected to the array, and the radiating grating. Top right inset shows the 1×3 splitter. Bottom right inset shows the distribution of waveguides in the array. (b) Measured far-field intensity pattern of the POPA with an FWHM beam size of 2.74°×3.76° and corresponding far-field image captured by the near-infrared camera at port -2. Right inset shows the full 2D far-field image of the beam spot. (c) Measured optical power versus angle at different angles in θy direction, showing a ±21.27° viewing angle (marked with different colors); right inset shows composition of far-field patterns from 12-port switching.
    (a) Illustration of the Si metasurface integrated on the region of LNOI grating with geometric phase. (b) Schematic of the integrated metasurfaces’ optical antenna for POPA. (c) Numerically simulated phase shifts (RCP and LCP) and polarization conversion rate (PCR) as a function of rotation angle of a meta-atom, driven by a guide wave with LP. (d) Deflection beam angle versus the incident angle without or with metasurfaces.
    Fig. 4. (a) Illustration of the Si metasurface integrated on the region of LNOI grating with geometric phase. (b) Schematic of the integrated metasurfaces’ optical antenna for POPA. (c) Numerically simulated phase shifts (RCP and LCP) and polarization conversion rate (PCR) as a function of rotation angle of a meta-atom, driven by a guide wave with LP. (d) Deflection beam angle versus the incident angle without or with metasurfaces.
    (a), (b) SEM images of the fabricated metasurface structure in the experiment. (c) Steered beams quantized by the normalized intensity distribution from the different incident ports with different colors. (d) Fourteen slices of beam profiles of the far-field image with different input ports stitched together to show beam steering, in which the boxed port -6 case is highlighted for detailed analyses. (e), (f) Measured far-field emission pattern of port -6_RCP and port 6_LCP, demonstrating −10.31 dB and −12.06 dB peak-to-sidelobe ratio for the beam pointing toward (−36.57°,+3.65°).
    Fig. 5. (a), (b) SEM images of the fabricated metasurface structure in the experiment. (c) Steered beams quantized by the normalized intensity distribution from the different incident ports with different colors. (d) Fourteen slices of beam profiles of the far-field image with different input ports stitched together to show beam steering, in which the boxed port -6 case is highlighted for detailed analyses. (e), (f) Measured far-field emission pattern of port -6_RCP and port 6_LCP, demonstrating 10.31  dB and 12.06  dB peak-to-sidelobe ratio for the beam pointing toward (36.57°,+3.65°).
    Schematic of the experimental setup for near-field and far-field imaging measurements. The extracted light in free space was collected by objective 2 (NA=0.75) and then transmitted through tube lens 1, lens 2, and lens 3. The red path corresponds to near-field imaging, and green corresponds to far-field imaging with L3 removed. A λ/4 plate and a linear polarizer are used to observe RCP and LCP beams in the metasurface-based POPA, separately.
    Fig. 6. Schematic of the experimental setup for near-field and far-field imaging measurements. The extracted light in free space was collected by objective 2 (NA=0.75) and then transmitted through tube lens 1, lens 2, and lens 3. The red path corresponds to near-field imaging, and green corresponds to far-field imaging with L3 removed. A λ/4 plate and a linear polarizer are used to observe RCP and LCP beams in the metasurface-based POPA, separately.
    Normalized far-field pattern along the θx axis for wavelengths from 1470 nm to 1565 nm.
    Fig. 7. Normalized far-field pattern along the θx axis for wavelengths from 1470 nm to 1565 nm.
    Simulation data for 2D parameter sweeps of α-Si nanopillars with height of 1 μm. (a), (b) Simulated phase shifts and intensity of transmission coefficients of nanostructures for x- and y-polarization beams with various wx and wy. These four graphs constitute the library for the parameters of our metasurface layers. (c) Simulated polarization conversion rate (PCR) of each nanostructure for LCP to RCP. (d) Transmission and PCR versus incident angle.
    Fig. 8. Simulation data for 2D parameter sweeps of α-Si nanopillars with height of 1 μm. (a), (b) Simulated phase shifts and intensity of transmission coefficients of nanostructures for x- and y-polarization beams with various wx and wy. These four graphs constitute the library for the parameters of our metasurface layers. (c) Simulated polarization conversion rate (PCR) of each nanostructure for LCP to RCP. (d) Transmission and PCR versus incident angle.
    Procedure for fabricating the proposed metasurface-based POPA device.
    Fig. 9. Procedure for fabricating the proposed metasurface-based POPA device.
    Zhizhang Wang, Wange Song, Yuxin Chen, Bin Fang, Jitao Ji, Haoran Xin, Shining Zhu, Tao Li. Metasurface empowered lithium niobate optical phased array with an enlarged field of view[J]. Photonics Research, 2022, 10(11): B23
    Download Citation