
Xiuqi FANG, Xue ZHENG, Xing ZHANG. Correspondence between the large volcanic eruptions and ENSO events over AD 1525–2000[J]. Journal of Geographical Sciences, 2020, 30(1): 103
- Journal of Geographical Sciences
- Vol. 30, Issue 1, 103 (2020)
Abstract
1 Introduction
Both volcanic eruptions and the El Niño-Southern Oscillation (ENSO) could lead to global climatic anomalies with worldwide impacts (
Handler (1984) first reported that low-latitude explosive volcanic eruptions increase the probability of El Niño events based on reconstructed historical volcanoes and SST (sea surface temperature) data from 1866 to 1982. However, the study was questioned due to its lack of statistical robustness, and the relationship between volcanic eruptions and ENSO has been a subject of active research since then (
Climate model simulation is one of the primary methodologies for exploring the impact of volcanic eruptions on ENSO. However, the discrepancies in the mechanisms of the impacts of volcanic eruptions on ENSO still exist among different simulated results. Some of the results concerning how ENSO responds to volcanic forcings are controversial or even present contradictions. Mann et al. (2005) and Ohba et al. (2013) proposed the likelihood of an El Niño anomaly response to volcanic eruptions based on Zebiak-Cane and CGCM models. Mann’s theory relied on the well-known hypothesis of the dynamical thermostat mechanism (
To explore the facts more closely, more credible proof of the relationship between volcanoes and ENSO could be obtained by comparing and analyzing the historically occurring volcanic eruptions and ENSO events. Relevant research has been increasingly focused on improving the reconstructions of volcanic eruptions and ENSO since
This work aims to show the relationship between ENSO and volcanic events using additional facts and perspectives. Specifically, this study based on the reconstructed volcanic and ENSO sequences from 1525 to 2000 manufactured multidimensional groups of volcanic eruption events and varied ENSO types, magnitudes, amounts and so on. Furthermore, we conducted a statistical analysis of each matched group to determine the impact of volcanic eruptions on ENSO events.
2 Data and methods
2.1 Data sources
The volcanic sequence was taken from the open access Volcanic Eruption Chronology, consisting of 1449 events since the Holocene and reconstructed by Smithsonian Institution Global Volcanic Project of the United States (http://volcano.si.edu/). This chronology includes the name, location, altitude, Volcanic Eruption Index (VEI), and time (starting, ending and duration) of these events. The VEI is regarded as the most effective reference for describing historical explosive volcanism, whose magnitudes can be estimated on a scale from 0 to 8 (
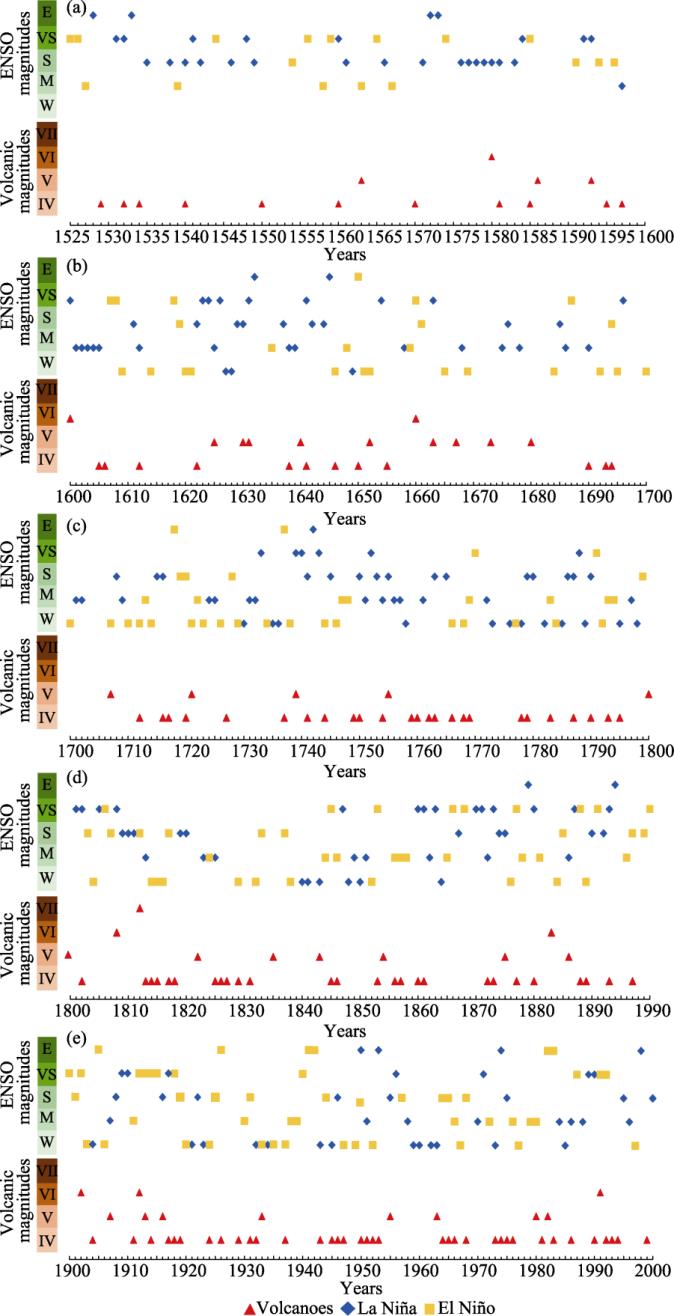
The ENSO dataset was derived from the chronology of ENSO events from 1525 to 2000 produced by Gergis and Fowler (2009) and based on 15 sequences of tree rings, coral reefs, ice cores, historical achieves, etc. This chronology not only incorporates ENSO event types but also includes a criteria indicator of the Quality adjusted Magnitude (MQ) to classify the magnitude of ENSO (El Niño /La Niña) events. According to the MQ score, a higher score corresponds to a stronger rank, and all ENSO events were divided into five grades: extreme (E), very strong (VS), strong (S), moderate (M), and weak (W) (
2.2 Methods
195 large volcanic eruptions (VEI≥4) were extracted from between 1525-2000 from the Volcanic Eruption Chronology (
The ENSO events during 1525-2000 were classified as one of two types, El Niño or La Niña, within each year. If both El Niño event (El) and La Niña event (La) signals existed in the same year in the above compiled ENSO chronology given by Gergis and Fowler (
To analyze the features of the types and amounts of ENSO events in the years following the large volcanic eruptions (VEI≥4), the selected large volcanic eruptions and ENSO events were matched year by year from 1525 to 2000. Generally, hemispheric or global cooling effects caused by a large volcanic eruption could last at least 1-2 years (
The impacts of volcanic eruptions on ENSO events depend on the atmospheric circulation and the dispersion path and distribution of volcanic ejected materials (
![]()
Figure 1.
The amounts, types, and magnitudes of ENSO events occurring within the 0-2 years after large eruptions were accounted for annually to obtain a better understanding of the proceeding and inner mechanisms of the ENSO response to large volcanic eruptions.
Both z-test and t-test are widely used method for the significance testing. Under the premise of unifying the corresponding distribution pattern, z-test is usually used for large samples (≥30), while t-test is used for small samples (≤30). In this study, a z-test was used foe the significance testing between ENSO events amounts following large eruptions and those with no eruptions in the 3 (0-2) years preceding their occurrence; a t-test was used for the significance testing between each of the five magnitudes of ENSO events within the 3 years following an eruption and those that without a preceding eruption. The significance level was α=0.05 (
3 Results
3.1 Impacts of large eruptions (VEI≥4) on the types and amounts of ENSO events
3.1.1 Difference in the amounts of ENSO events within the 0-2 years with and without a large eruption
The probability of ENSO events occurring within the 3 (0-2) years following a large volcanic eruption more likely increased relative to periods without a large volcanic eruption. In 1525-2000, there were a total of 195 large volcanic eruptions, and 398 years with ENSO events. Of the years with ENSO events, there were 272 years, accounting for 68.3% of the total, fell within the range of 3 years after a large eruption; another 126 ENSO events occurred without a large eruption occurring within the 3 years prior to these ENSO events, accounting for 31.7% of the total. That is, the ENSO events occurring within 3 years following a large eruption are more common than those without eruptions in the previous 0-2 years by 36.6 percentage points (
| Volcanic eruption | El Niño | La Niña | ENSO |
|---|---|---|---|
| No-eruption (in the prior 0-2 years) | 51 (40.5%) | 75 (59.5%) | 126 (31.7%) |
| Eruptions (in the prior 0-2 years) | 137 (50.4%) | 135 (49.6%) | 272 (68.3%) |
| Total | 188 (47.2%) | 210 (52.8%) | 398 (100%) |
| No-eruptions%: Eruptions% | 27.1: 72.9 | 35.7: 64.3 | 31.7: 68.3 |
Table 1.
Amounts and percentage of ENSO events occurring in the two scenarios with and without large eruptions during 1525-2000
There was a high probability of ENSO events occurring in the same year with a large volcanic eruption. Of the 272 ENSO events that occurred after large volcanic eruptions, 47.8% were within the same year as with the large volcanic eruptions, 29.4% were within the next (+1) year and 22.8% were within the next +2 year (
![]()
Figure 2.
3.1.2 Difference in the ratio of El Niño to La Niña events after large volcanic eruptions
The proportion of El Niño years increased significantly following large volcanic eruptions. Of the 126 ENSO events without large volcanic eruptions occurring in the prior 0-2 years, the ratio of El Niño to La Niña events was approximately 2:3. Of the 272 ENSO events that occurred within 0-2 years after the large volcanic eruptions, the ratio of El Niño to La Niña events was approximately 1:1 (
Both the numbers of El Niño and La Niña events decreased from 0 to 2 years after the large volcanic eruptions, as did ENSO events overall (
3.1.3 Differences in the amounts and types of ENSO events following large volcanic eruptions occurring in different regions
There were no significant discrepancies in all of the regions between the percentages of eruptions and ENSO events occurred within 0-2 years after the eruptions during 1525 to 2000. Of the 195 large eruptions and the 272 ENSO events following these eruptions within the 3 years during 1525-2000, 38.5% eruptions and 36.8% ENSO events occurred in the equatorial zone; 27.2% eruptions and 31.3% ENSO events occurred in the low-middle latitudes of the Northern Hemisphere;25.6% eruptions and 26% ENSO events occurred in the high latitudes of the Northern Hemisphere; while 8.7% eruptions and 5.9% ENSO events occurred in the Southern Hemisphere (
![]()
Figure 3.
Differences existed among the percentage of those ENSO events occurring within the 0, +1, and +2 years after the large volcanic eruptions in the four regions, although the percentage was the largest in the year of the eruption in all regions and globally. In the equatorial zone, 52% of ENSO events occurred in the year of the eruption. In the low-middle latitudes of the Northern Hemisphere (15°N-50°N), only 43.5% of ENSO events occurred in the year of the eruption. For the high latitudes of the Northern Hemisphere (north of 50°N), 48% of ENSO events occurred in the year of the eruption that was much closer to the 47.8% accounted globally in the 0 year of eruption, but the percentage of events occurred in the +2 year was slightly higher than that in the +1 year. In the Southern Hemisphere (south of 15°S), the percentage of ENSO events occurred in the +1 year of the eruption was much higher than the 29.4% accounted globally in the +1 year after the eruption, but those occurred in the 0 and +2 years were lower than the 47.8% and 22.8% accounted globally in the 0 year and +2 year after the eruption, respectively (
![]()
Figure 4.
Differences were also found in the ratios of La Niña to El Niño events occurred within the 3 years after a large volcanic eruption in the four regions. In the equatorial and low-latitudes Northern Hemisphere zones, La Niña events occurred less often than El Niño events, with ratios of 0.85:1 and 0.93:1 in the 0-2 years and 0.86:1 and 0.76:1 in the 0 year, respectively. In contrast, the number of La Niña events exceeded those of El Niño events in the Northern Hemisphere’s high latitudes and the Southern Hemisphere, where the ratios were 1.15:1 and 1.67:1 in the 0-2 years and 1.27:1 and 6:1 in the 0 year, respectively (
3.2 Impacts of large eruptions (VEI≥4) on the magnitudes of ENSO events
3.2.1 Differences in magnitudes of ENSO events within 0-2 years with and without a large eruption
There was significant difference by t-test between the percentages of ENSO events in various magnitudes occurring in the +1 and +2 years following the eruptions and those without a preceding eruption on the significance level of 0.05 and 0.01, respectively. Within 0-2 years after volcanic eruptions, both the percentage of the weak and strong ENSO events showed a downward trend, whereas, the others including the moderate, very strong and extreme ENSO events respectively presented an upward trend than that with no eruptions (
![]()
Figure 5.
Either El Niño or La Niña, the difference between the percentages of various magnitude events occurring in the +1 and +2 years after large eruptions and no eruptions before that passed the significant level of α=0.05. For the El Niño events that occurred within the 0-2 years following an eruption, the weak El Niño events were more by 8 percentage points and the very strong El Niño events were less by 10 percentage points than that with no eruptions. As to the La Niña events, it was relatively distinct that the weak La Niña events were less by 15 percentage points and the very strong events were more by 11.4 percentage points than that no eruptions (
3.2.2 Differences in the magnitudes of El Niño events among the 0-2 years following large volcanic eruptions
The weak El Niño events were more common than other types in each year of 0-2 years after a large volcanic eruption, which totally accounted for 41% of the post-eruption El Niño events (
3.2.3 Differences in magnitudes of La Niña events within 0-2 years following large volcanic eruptions
The strong La Niña events were more common than the other magnitude types in the 0 year and +1 year, and the strong La Niña events had a largest increase from the 0 year to the +1 year after volcanic eruptions. While the moderate La Niña events were more common in the +2 year (
The weak La Niña events occurred in the 0 year, the +1 year, and the +2 year after the eruptions accounted for 17%, 8.1%, and 24.2% of the total La Niña events in the same years, respectively. The moderate La Niña events occurred in the 0 year, the +1 year, and the +2 year accounted for 21.5%, 24% and 27.3% of the total in the same years, respectively. The strong La Niña events occurred in the 0 year, the +1 year, and the +2 year accounted for 29.2%, 38% and 18.2% of the total in the same years, respectively. The very strong La Niña events occurred in the 0 year, the +1 year, and the +2 year accounted for 27.7%, 18.9%, and 24.2% of the total in the same years, respectively. The extreme La Niña events occurred in the 0 year, the +1 year, and the +2 year after the eruptions accounted for 4.6%, 11% and 6.1% of the total La Niña events in the same years.
3.2.4 Differences in magnitudes of ENSO events after large volcanic eruptions in different regions
There were regional differences in the probability distributions of the magnitudes of El Niño and La Niña events occurring within the 0-2 years after a large volcanic eruption.
More weaker El Niño events and more stronger La Niña events tended to occur after large volcanic eruptions in all zones. However, the ratios of the El Niño events to the La Niña events of different magnitudes varied significantly from zone to zone. For the 100 ENSO events in the equatorial zone, the ratio of El Niño to La Niña events was 1:0.85. The ratio of the weak El Niño events to the weak La Niña events was 1:0.41, and the ratio of the very strong El Niño events to the very strong La Niña events was 1:3 (
Of the 85 ENSO events in the low-middle latitudes of the Northern Hemisphere, the ratio of El Niño to La Niña events was 1:0.93. Meanwhile, the ratios of weak and moderate El Niño events to the same magnitudes of La Niña events were 1:0.5 and 1:0.46, respectively. The ratios of strong and extreme El Niño events to the same magnitudes of La Niña events were 1:3.5 and 1:3, respectively (
![]()
Figure 6.
In the high latitudes of the Northern Hemisphere, there were 71 ENSO events and a ratio of 1:1.15 of El Niño to La Niña events. The ratios of weak and extreme El Niño events to the same magnitudes of La Niña events were 1:0.31 and 1:0.5, respectively. In addition, the ratios of the moderate, strong and very strong El Niño events to the same magnitudes of La Niña events were 1:3.25, 1:1.67 and 1:1.8, respectively (
In the Southern Hemisphere, among the 16 ENSO events occurring after large volcanic eruptions, 4 were weak El Niño events, 4 were very strong La Niña events and 2 were extreme La Niña events (
3.3 Impacts of large eruptions on the temporal distribution of ENSO events
Among the 195 volcanic eruptions during 1525 to 2000, 41% of eruptions were followed by 1 ENSO event, with 35.1%, 3.7% and 2.2% occurring in the 0, +1, and +2 year after an eruption, respectively (
Among the ENSO events that occurred in the 2 consecutive years following large volcanic eruptions, 44%, 31% and 25% showed that the magnitude decreased, enhanced and unchanged in the second year, respectively (
![]()
Figure 7.
4 Discussion
It was first pointed out by Handler (1984) that ENSO as an interannual mode of climate system could be affected by volcanic eruptions. He proposed that the probability of an El Niño-like event would increase after low-latitude volcanic eruptions based on the historical volcanic eruptions and SST data from 1866 to 1982 (
The results of this paper show the low-latitudes of Northern Hemisphere and tropical volcanic eruptions might easily trigger an El Niño-like event, whereas a La Niña-like event was found to respond to the Southern Hemisphere eruptions. It agrees with the previous studies both based on proxy-based reconstructions and modeling (
5 Conclusions
Both volcanic eruptions and the El Niño-Southern Oscillation (ENSO) could lead to global climatic anomalies with worldwide impacts. Study on the relationship between volcanic eruption and ENSO is of importance for better understanding how they interact in driving global or regional extreme climate events.
By matching the 195 large volcanic eruptions (VEI≥4) with the types and magnitudes of 398 ENSO events present in the 0-2 years after the eruptions occurred from 1525 to 2000, an analysis of the correspondence between the large volcanic eruptions and ENSO events was performed. The results show that the large volcanic eruptions could affect the occurrence of ENSO events in multi-aspects as follows:
(1) In 1525-2000, the ENSO events that occurred within the 0-2 years after a large volcanic eruption (VEI≥4) were greater than that without an eruption by 36.6 percentage points; the ratio of El Niño to La Niña events changed from 2:3 to 1:1; the number of ENSO events following eruptions was the greatest (47.8%) in the 0 year rather than in the +1 year (29.4%) or in the +2 year (22.8%).
(2) There were more El Niño events than La Niña events occurred in the 0 year after the eruptions in the regions of equator and Northern Hemisphere’s low-middle latitudes; but more La Niña events in the 0 year after the eruptions in the high-latitudes of the Northern Hemisphere and the Southern Hemisphere.
(3) Weak El Niño events occurred more often than all other types in all of the 0-2 years after a large volcanic eruption. While strong La Niña events occurred more than other types in the 0 year and +1 year following the volcanic eruptions; moderate La Niña events were more common in the +2 year.
(4) Some 41% of the large eruptions were followed by 1 ENSO event. 26.9% and 23.1% of the eruptions were followed by 2 or 3 consecutive ENSO events, respectively. In both cases of the 2 and 3 consecutive ENSO events, the ENSO magnitudes were dominated by a decreasing trend.
References
[1] B Adams J, E Mann M, M Ammann C. Proxy evidence for an El Niño-like response to volcanic forcing. . Nature, 426, 274-278(2003).
[2] R Briffa K, D Jones P, H Schweingruber F et al. Influence of volcanic eruptions on Northern Hemisphere summer temperature over the past 600 years. Nature, 393, 450-455(1998).
[3] J Bjerknes. Atmospheric teleconnections from the equatorial Pacific. Monthly Weather Review, 97, 163-172(1969).
[4] D Cheng, Y Cui, F Su et al. The characteristics of the Mocoa compound disaster event, Colombia. Landslides, 15, 1223-1232(2018).
[5] C Clement A, R Seager, A Cane M et al. An ocean dynamical thermostat. Journal of Climate, 9, 2190-2196(1996).
[6] M Collins, I An S, W Cai et al. The impact of global warming on the tropical Pacific Ocean and El Niño. Nature Geoscience, 3, 391-397(2010).
[7] V Damodaran, R Allan, J Ogilvie A E et al. The 1780s: Global climate anomalies, floods, droughts, and famines. The Palgrave Handbook of Climate History(2018).
[8] M Davis. Late Victorian Holocausts: El Niño Famines and the Making of the Third World(2001).
[9] R D’Arrigo, R Wilson, A Tudhope. The impact of volcanic forcing on tropical temperatures during the past four centuries. Nature Geoscience, 2, 51-56(2009).
[10] Z Deng X, K Huang J, B Qiao F et al. Impacts of El Niño-Southern Oscillation events on China’s rice production. Journal of Geographical Sciences, 20, 3-16(2010).
[11] C Deser, A Alexander M, P Xie S et al. Sea surface temperature variability: Patterns and mechanisms. Annual Review of Marine Science, 2, 115-143(2010).
[12] M Dilley, N Heyman B. ENSO and disaster: Droughts, floods and El Niño/Southern Oscillation warm events. Disasters, 19, 181-193(1995).
[13] Y Ding, A Carton J, A Chepurin G et al. Ocean response to volcanic eruptions in Coupled Model Intercomparison Project 5 simulations. Journal of Geophysical Research: Oceans, 119, 5622-5637(2014).
[14] G Dutton E, R Christy J. Solar radiative forcing at selected locations and evidence for global lower tropospheric cooling following the eruptions of El Chichón and Pinatubo. Geophysical Research Letters, 19, 2313-2316(1992).
[15] J Emile-Geay, R Seager, A Cane M et al. Volcanoes and ENSO over the past millennium. Journal of Climate, 21, 3134-3148(2008).
[16] L Gergis J, M Fowler A. A history of ENSO events since AD 1525: Implications for future climate change. Climatic Change, 92, 343-387(2009).
[17] P Handler. Possible association of stratospheric aerosols and El Niño type events. Geophysical Research Letters, 11, 1121-1124(1984).
[18] P Handler. Possible association between the climatic effects of stratospheric aerosols and sea surface temperatures in the eastern tropical Pacific Ocean. Journal of Climatology, 6, 31-41(1986).
[19] Z Hao, H Wang, J Zheng. Spatial and temporal distribution of large volcanic eruptions from 1750 to 2010. Journal of Geographical Sciences, 24, 1060-1068(2014).
[20] X Hao Z, Y Zheng J, F Wu G et al. 1876-1878 severe drought in North China: Facts, impacts and climatic background. Chinese Science Bulletin, 55, 3001-3007(2010).
[21] R Harshvardhan M. Perturbation of the zonal radiation balance by a stratospheric aerosol layer. Journal of the Atmosphere Sciences, 36, 1274-1285(1979).
[23] . Climate Change 2013: The Physical Science Basis. Contribution of Working Group I to the Fifth Assessment Report of the Intergovernmental Panel on Climate Change(2013).
[25] D King A, J van Oldenborgh G, J Karoly D. Climate change and El Niño increase likelihood of Indonesian heat and drought. Bulletin of the American Meteorological Society, 97, S113-S117(2016).
[26] H H. Volcanic dust in the atmosphere; with a chronology and assessment of its meteorological significance. Philosophical Transactions of the Royal Society of London. Series A, Mathematical and Physical Sciences, 266, 425-533(1970).
[27] F Lehner, P Schurer A, C Hegerl G et al. The importance of ENSO phase during volcanic eruptions for detection and attribution. Geophysical Research Letters, 43, 2851-2858(2016).
[28] J Li, P Xie S, R Cook E et al. El Niño modulations over the past seven centuries. Nature Climate Change, 3, 822-826(2013).
[29] G Lim H, W Yeh S, S Kug J et al. Threshold of the volcanic forcing that leads the El Niño-like warming in the last millennium: results from the ERIK simulation. Climate Dynamics, 46, 3725-3736(2016).
[30] F Liu, J Li, B Wang et al. Divergent El Niño responses to volcanic eruptions at different latitudes over the past millennium. Climate Dynamics, 50, 3799-3812(2018).
[31] F Liu, C Xing, L Sun et al. How do tropical, Northern Hemispheric, and Southern Hemispheric volcanic eruptions affect ENSO under different initial ocean conditions?. Geophysical Research Letters, 45, 13,041-13,049(2018).
[32] N Maher, S McGregor, H England M et al. Effects of volcanism on tropical variability. Geophysical Research Letters, 42, 6024-6033(2015).
[33] E Mann M, A Cane M, E Zebiak S et al. Volcanic and solar forcing of the tropical Pacific over the past 1000 years. Journal of Climate, 18, 447-456(2005).
[34] C Mass, H Schneider S. Statistical evidence on the influence of sunspots and volcanic dust on long-term temperature records. Journal of the Atmospheric Sciences, 34, 1995-2004(1977).
[35] C McGraw M, A Barnes E, C Deser. Reconciling the observed and modeled Southern Hemisphere circulation response to volcanic eruptions. Geophysical Research Letters, 43, 7259-7266(2016).
[36] S McGregor, A Timmermann. The effect of explosive tropical volcanism on ENSO. Journal of Climate, 24, 2178-2191(2011).
[37] S McGregor, A Timmermann, O Timm. A unified proxy for ENSO and PDO variability since 1650. Climate of the Past, 6, 1-17(2010).
[38] A Meque, J Abiodun B. Simulating the link between ENSO and summer drought in Southern Africa using regional climate models. Climate Dynamics, 44, 1881-1900(2015).
[39] V Mishra, D Tiwari A, S Aadhar et al. Drought and famine in India, 1870-2016. Geophysical Research Letters, 46, 2075-2083(2019).
[40] G Newhall C, S Self. The volcanic explosivity index (VEI): An estimate of explosive magnitude for historical volcanism. Journal of Geophysical Research: Oceans, 87, 1231-1238(1982).
[41] U Niemeier, C Timmreck, F Graf H et al. Initial fate of fine ash and sulfur from large volcanic eruptions. Atmospheric Chemistry and Physics, 9, 9043-9057(2009).
[42] M Ohba, H Shiogama, T Yokohata et al. Impact of strong tropical volcanic eruptions on ENSO simulated in a coupled GCM. Journal of Climate, 26, 5169-5182(2013).
[43] C Oliver R. On the response of hemispheric mean temperature to stratospheric dust: An empirical approach. Journal of Applied Meteorology, 15, 933-950(1976).
[45] R Pausata F S, C Karamperidou, R Caballero et al. ENSO response to high-latitude volcanic eruptions in the Northern Hemisphere: The role of the initial conditions. Geophysical Research Letters, 43, 8694-8702(2016).
[46] E Predybaylo, L Stenchikov G, T Wittenberg A et al. Impacts of a Pinatubo-size volcanic eruption on ENSO. Journal of Geophysical Research: Atmospheres, 122, 925-947(2017).
[47] R Rampino M, S Self. Sulphur-rich volcanic eruptions and stratospheric aerosols. Nature, 310, 677-679(1984).
[48] A Robock. Volcanic eruptions and climate. Reviews of Geophysics, 38, 191-219(2000).
[49] A Robock, J Mao. The volcanic signal in surface temperature observations. Journal of Climate, 8, 1086-1103(1995).
[50] D Santer B, C Bonfils, F Painter J et al. Volcanic contribution to decadal changes in tropospheric temperature. Nature Geoscience, 7, 185-189(2014).
[51] S Self, R Rampino M. The relationship between volcanic eruptions and climate change: Still a conundrum?. Eos, Transactions American Geophysical Union, 69, 74-86(1988).
[52] S Self, R Rampino M, J Zhao et al. Volcanic aerosol perturbations and strong El Niño events: No general correlation. Geophysical Research Letters, 24, 1247-1250(1997).
[53] Z Sheng, Q Xie S, Y Pan C. Probability Theory and Mathematical Statistics Course. 4th ed.(2008).
[54] L Siebert, T Simkin, P Kimberly. Volcanoes of the World. 3rd ed.(2011).
[55] M Sigl, M Winstrup, R McConnell J et al. Timing and climate forcing of volcanic eruptions for the past 2,500 years. Nature, 523, 543-549(2015).
[58] S Stevenson, B Otto-Bliesner, J Fasullo et al. “El Niño like” hydroclimate responses to last millennium volcanic eruptions. Journal of Climate, 29, 2907-2921(2016).
[59] H Stommel, E Stommel. The year without a summer. Nature Geoscience, 77, 2077-2094(2010).
[60] L Taylor B, T Gal‐Chen, H Schneider S. Volcanic eruptions and long-term temperature records: An empirical search for cause and effect. Quarterly Journal of the Royal Meteorological Society, 106, 175-199(1980).
[61] J Thompson D W, M Wallace J, D Jones P et al. Identifying signatures of natural climate variability in time series of global-mean surface temperature: Methodology and insights. Journal of Climate, 22, 6120-6141(2009).
[62] C Timmreck. Modeling the climatic effects of large explosive volcanic eruptions. Wiley Interdisciplinary Reviews: Climate Change, 3, 545-564(2012).
[63] E Trenberth K, D Jones P, P Ambenje et al. Observations: Surface and atmospheric climate change. In: Solomon S et al. (eds.). Climate Change 2007: The Physical Science Basis, 235-336(2007).
[64] M Vicente-Serrano S, E Aguilar, R Martínez et al. The complex influence of ENSO on droughts in Ecuador. Climate Dynamics, 48, 405-427(2017).
[65] C Wang, C Deser, Y Yu J et al. El Niño and southern oscillation (ENSO): A review. Coral Reefs of the Eastern Pacific, 8, 3-19(2012).
[66] T Wang, D Guo, Y Gao et al. Modulation of ENSO evolution by strong tropical volcanic eruptions. Climate Dynamics, 51, 2433-2453(2018).
[67] R Yamamoto, T Iwashima, M Hoshiai. Change of the surface air temperature averaged over the Northern Hemisphere and large volcanic eruptions during the year 1951-1972. Journal of the Meteorological Society of Japan. Ser. II, 53, 482-486(1975).
[68] E Zebiak S, B Orlove, G Muñoz Á et al. Investigating El Niño-Southern Oscillation and society relationships. Wiley Interdisciplinary Reviews: Climate Change, 6, 17-34(2015).
[69] D Zhang, R Blender, K Fraedrich. Volcanoes and ENSO in millennium simulations: Global impacts and regional reconstructions in East Asia. Theoretical and Applied Climatology, 111, 437-454(2013).
[70] G Zhang F, G Zhang X. The relation between large volcanic eruption in the world and the drought/flood in summer in China. Journal of Natural Disasters, 3, 40-46(1994).


Set citation alerts for the article
Please enter your email address

© Copyright 2018-2021 | Chinese Laser Press. All Rights Reserved 沪ICP备15018463号-20