• Photonics Research
  • Vol. 9, Issue 7, 1218 (2021)
Lei Tang1, Jiangshan Tang1, Haodong Wu1, Jing Zhang2、3, Min Xiao1、4, and Keyu Xia1、*
Author Affiliations
  • 1College of Engineering and Applied Sciences, National Laboratory of Solid State Microstructures, Collaborative Innovation Center of Advanced Microstructures, Nanjing University, Nanjing 210093, China
  • 2Department of Automation, Tsinghua University, Beijing 100084, China
  • 3Center for Quantum Information Science and Technology, Tsinghua National Laboratory for Information Science and Technology (TNList), Beijing 100084, China
  • 4Department of Physics, University of Arkansas, Fayetteville, Arkansas 72701, USA
  • show less
    DOI: 10.1364/PRJ.413286 Cite this Article Set citation alerts
    Lei Tang, Jiangshan Tang, Haodong Wu, Jing Zhang, Min Xiao, Keyu Xia. Broad-intensity-range optical nonreciprocity based on feedback-induced Kerr nonlinearity[J]. Photonics Research, 2021, 9(7): 1218 Copy Citation Text show less
    Schematic diagram of the nonreciprocal propagation system. (a) Schematic of the system consisting of a feedback circuit and an FP cavity containing an EO nonlinear crystal. The feedback circuit includes a low-pass filter (LPF), an electric amplifier (Amp), and two photodetectors (PD1 and PD2). Left-handed incident light propagates in the forward direction and transmits through the beam splitter (BS) to excite the cavity. The reflected light of the cavity is reflected by the BS and a mirror successively, and then it is detected by PD1. The output current of PD1 is filtered by the LPF and amplified by the amplifier. Then the current modulates the EO nonlinear crystal and changes the transmission of the cavity. PD2 is used to monitor a fraction of the left-handed incident light and control the gain of the amplifier. Right-handed incident light moves in the backward direction, transmits through the cavity, and is reflected by the BS and the mirror and then captured by PD1. In the same way, the output current drives the EO nonlinear crystal and modulates the transmission of the cavity. (b) Transmission spectrum of the system. Black curves are for transmissions of the FP cavity without feedback. Blue (red) curves are for transmissions of the feedback-modulated cavity in the forward (backward) case. Green vertical bar is for the frequency of incident light (ωin). Black vertical bar is for one of the eigenfrequencies of the cavity (ω0).
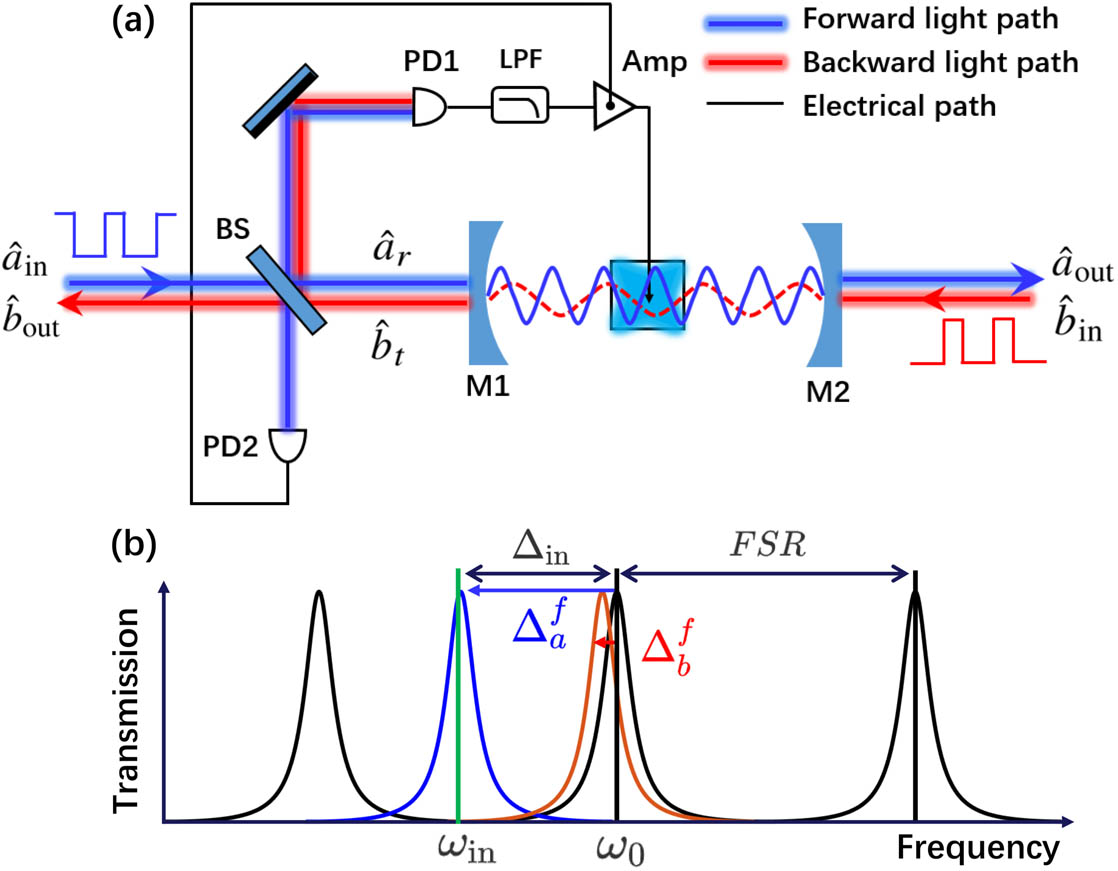
    Fig. 1. Schematic diagram of the nonreciprocal propagation system. (a) Schematic of the system consisting of a feedback circuit and an FP cavity containing an EO nonlinear crystal. The feedback circuit includes a low-pass filter (LPF), an electric amplifier (Amp), and two photodetectors (PD1 and PD2). Left-handed incident light propagates in the forward direction and transmits through the beam splitter (BS) to excite the cavity. The reflected light of the cavity is reflected by the BS and a mirror successively, and then it is detected by PD1. The output current of PD1 is filtered by the LPF and amplified by the amplifier. Then the current modulates the EO nonlinear crystal and changes the transmission of the cavity. PD2 is used to monitor a fraction of the left-handed incident light and control the gain of the amplifier. Right-handed incident light moves in the backward direction, transmits through the cavity, and is reflected by the BS and the mirror and then captured by PD1. In the same way, the output current drives the EO nonlinear crystal and modulates the transmission of the cavity. (b) Transmission spectrum of the system. Black curves are for transmissions of the FP cavity without feedback. Blue (red) curves are for transmissions of the feedback-modulated cavity in the forward (backward) case. Green vertical bar is for the frequency of incident light (ωin). Black vertical bar is for one of the eigenfrequencies of the cavity (ω0).
    Nonreciprocal transmission properties. (a) Nonreciprocal transmission. Blue (red) curve is for the forward (backward) transmission Tfw (Tbw). (b) Average photon number inside the cavity. Blue (red) curve is for the forward (backward) case. (c) Feedback-induced resonance frequency shifts. Blue (red) curve is for the frequency shift in forward (backward) case. In the inset, the black dashed curve indicates the input detuning of −Δin=15κex. For the steady state, the feedback-induced frequency shift for the forward (backward) case is Δa,ssf≈14.6κex (Δb,ssf≈0.5κex). All calculations are obtained by solving Eqs. (7) and (14) numerically with parameters: γ=0.01, κi=0.2κex, ωc=190κex, A=12, Δin=−15κex, and Pin/ℏωin=830κex.
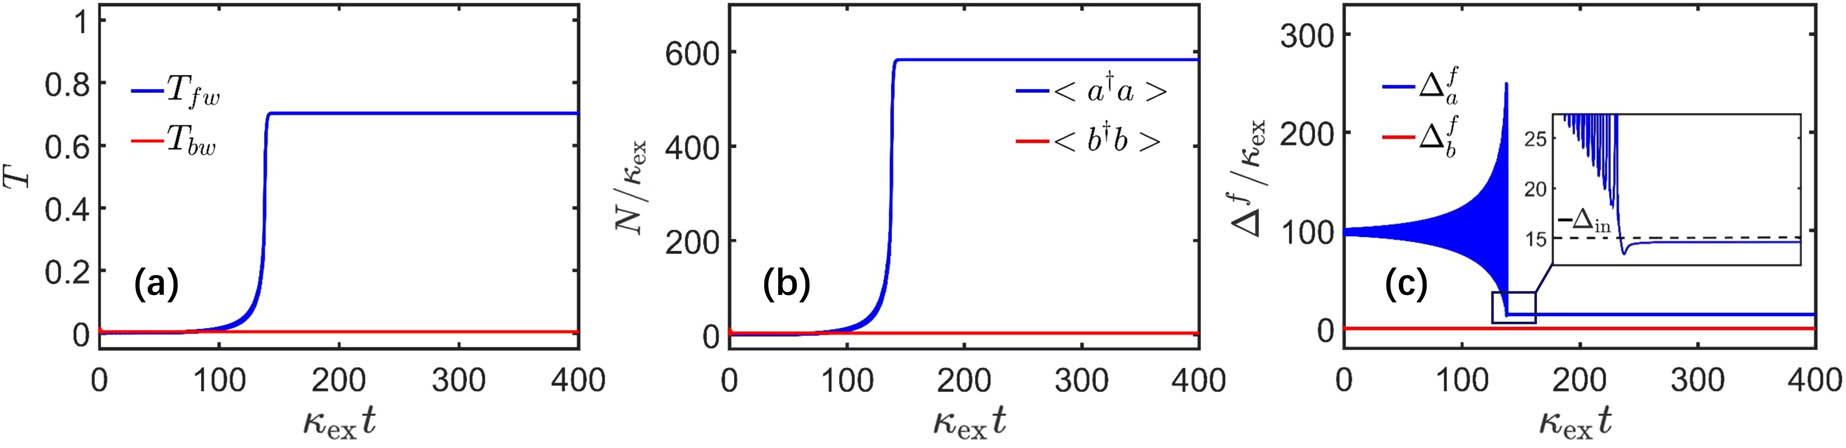
    Fig. 2. Nonreciprocal transmission properties. (a) Nonreciprocal transmission. Blue (red) curve is for the forward (backward) transmission Tfw (Tbw). (b) Average photon number inside the cavity. Blue (red) curve is for the forward (backward) case. (c) Feedback-induced resonance frequency shifts. Blue (red) curve is for the frequency shift in forward (backward) case. In the inset, the black dashed curve indicates the input detuning of Δin=15κex. For the steady state, the feedback-induced frequency shift for the forward (backward) case is Δa,ssf14.6κex (Δb,ssf0.5κex). All calculations are obtained by solving Eqs. (7) and (14) numerically with parameters: γ=0.01, κi=0.2κex, ωc=190κex, A=12, Δin=15κex, and Pin/ωin=830κex.
    Analytical and numerical steady-state results. Solid curves are for analytical results, and dots are for numerical results. (a) Blue (red) curve represents forward (backward) transmission versus log10(γ). (b) Blue (red) curve is for transmission contrast η (insertion loss ℒ) versus log10(γ) for κi=0.2κex. (c) Blue (red) curve represents forward (backward) transmission versus κi. (d) Blue (red) curve is for transmission contrast (insertion loss) versus κi for γ=0.01. Other parameters are ωc=190κex, A=12, and Δin=−15κex. For numerical calculations, the incident intensities are optimized values for the maximal forward transmissions.
    Fig. 3. Analytical and numerical steady-state results. Solid curves are for analytical results, and dots are for numerical results. (a) Blue (red) curve represents forward (backward) transmission versus log10(γ). (b) Blue (red) curve is for transmission contrast η (insertion loss ) versus log10(γ) for κi=0.2κex. (c) Blue (red) curve represents forward (backward) transmission versus κi. (d) Blue (red) curve is for transmission contrast (insertion loss) versus κi for γ=0.01. Other parameters are ωc=190κex, A=12, and Δin=15κex. For numerical calculations, the incident intensities are optimized values for the maximal forward transmissions.
    Steady-state transmissions of the non-adaptive feedback control system. (a), (b) Forward and backward transmissions versus input intensities and the detunings. (c) Forward (blue curve) and backward (red curve) transmissions versus input intensities for Δin=−15κex [white dotted transverse lines in (a) and (b)]. (d) Forward (blue curve) and backward (red curve) transmissions versus detunings for Pin/ℏωin=830κex [white dotted vertical lines in (a) and (b)]. All calculations are obtained by solving Eqs. (7) and (14) numerically with parameters: γ=0.01, κi=0.2κex, ωc=190κex, and A=12.
    Fig. 4. Steady-state transmissions of the non-adaptive feedback control system. (a), (b) Forward and backward transmissions versus input intensities and the detunings. (c) Forward (blue curve) and backward (red curve) transmissions versus input intensities for Δin=15κex [white dotted transverse lines in (a) and (b)]. (d) Forward (blue curve) and backward (red curve) transmissions versus detunings for Pin/ωin=830κex [white dotted vertical lines in (a) and (b)]. All calculations are obtained by solving Eqs. (7) and (14) numerically with parameters: γ=0.01, κi=0.2κex, ωc=190κex, and A=12.
    Steady-state transmissions of intensity-adaptive feedback control system. (a), (b) Forward and backward transmissions versus input intensities and detunings. (c) Blue (red) line is for forward (backward) transmission versus input intensities for Δin=−15κex [white dotted line in (a) and (b)]. (d) Conversion-amplification coefficients versus input intensities. All calculations are obtained with parameters: γ=0.01, κi=0.2κex, ωc=190κex, and Δa,inf,opt=104κex.
    Fig. 5. Steady-state transmissions of intensity-adaptive feedback control system. (a), (b) Forward and backward transmissions versus input intensities and detunings. (c) Blue (red) line is for forward (backward) transmission versus input intensities for Δin=15κex [white dotted line in (a) and (b)]. (d) Conversion-amplification coefficients versus input intensities. All calculations are obtained with parameters: γ=0.01, κi=0.2κex, ωc=190κex, and Δa,inf,opt=104κex.
    Propagation of rectangle pulses in forward and backward directions. Solid curves are the input rectangle pulse trains, and dashed curves are the transmitted pulses. Blue (red) curve shows the forward (backward) propagation of the pulses. τp is the pulse duration, and τd is the pulse delay between forward-input and backward-input pulses. All calculations are obtained by solving Eqs. (7) and (14) numerically with parameters: γ=0.01, κi=0.2κex, ωc=190κex, A=12, Δin=−15κex, and Pin/ℏω=830κex. The hysteresis duration τh is about 138κex−1.
    Fig. 6. Propagation of rectangle pulses in forward and backward directions. Solid curves are the input rectangle pulse trains, and dashed curves are the transmitted pulses. Blue (red) curve shows the forward (backward) propagation of the pulses. τp is the pulse duration, and τd is the pulse delay between forward-input and backward-input pulses. All calculations are obtained by solving Eqs. (7) and (14) numerically with parameters: γ=0.01, κi=0.2κex, ωc=190κex, A=12, Δin=15κex, and Pin/ω=830κex. The hysteresis duration τh is about 138κex1.
    Lei Tang, Jiangshan Tang, Haodong Wu, Jing Zhang, Min Xiao, Keyu Xia. Broad-intensity-range optical nonreciprocity based on feedback-induced Kerr nonlinearity[J]. Photonics Research, 2021, 9(7): 1218
    Download Citation