• Spectroscopy and Spectral Analysis
  • Vol. 41, Issue 7, 2301 (2021)
Mei GUO1、1; 2;, Ruo-yu ZHANG2、2; 3;, Rong-guang ZHU2、2; 3;, and Hong-wei DUAN1、1; 2; *;
Author Affiliations
  • 11. School of Agricultral Engineering, Jiangsu Uniersity, Zhenjiang 212013, China
  • 22. College of Mechanical and Electrical Engineering, Shihezi University, Shihezi 832003, China
  • show less
    DOI: 10.3964/j.issn.1000-0593(2021)07-2301-06 Cite this Article
    Mei GUO, Ruo-yu ZHANG, Rong-guang ZHU, Hong-wei DUAN. Quantitative Determination of Water-Soluble P in Biochar Based on NELIBS Technology and EN-SVR Model[J]. Spectroscopy and Spectral Analysis, 2021, 41(7): 2301 Copy Citation Text show less
    Schematic diagram of sample pretreatment process
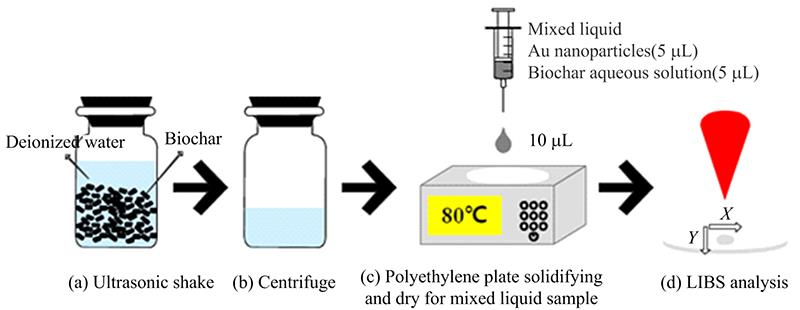
    Fig. 1. Schematic diagram of sample pretreatment process
    Analysis of sample droplet morphology
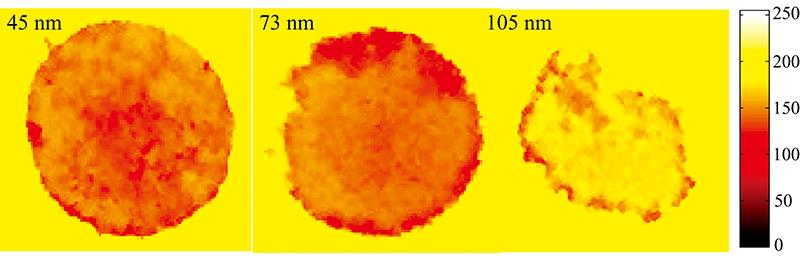
    Fig. 2. Analysis of sample droplet morphology
    Signal enhancement effect of gold nanoparticles with different sizes
    Fig. 3. Signal enhancement effect of gold nanoparticles with different sizes
    Univariate model(a): P 213.26 nm; (b): P 214.93 nm; (c): P 253.55 nm; (d): P 255.33 nm
    Fig. 4. Univariate model
    (a): P 213.26 nm; (b): P 214.93 nm; (c): P 253.55 nm; (d): P 255.33 nm
    Selected feature variables using ElasticNet
    Fig. 5. Selected feature variables using ElasticNet
    The optimal result of the characteristic multivariate regression model(a): SVR; (b): ARP and RSDP of predict
    Fig. 6. The optimal result of the characteristic multivariate regression model
    (a): SVR; (b): ARP and RSDP of predict
    分析线AuNPsRcal2RMSEC/
    (mg·kg-1)
    LOD/
    (mg·kg-1)
    Rp2RMSEP/
    (mg·kg-1)
    RSDP/%
    213.62 nm0.3607.59313.8970.9622.57225.86
    45 nm0.9771.4251.6760.9211.92719.37
    73 nm0.8753.3593.4190.3385.57956.09
    105 nm0.9192.7082.2870.5844.67847.03
    214.93 nm0.5676.24012.2950.8922.26522.77
    45 nm0.9930.7842.4390.9431.48214.90
    73 nm0.9042.9332.4540.2995.45854.87
    105 nm0.9392.3522.4470.6134.54345.67
    253.55 nm0.5386.45211.6110.8802.82028.35
    45 nm0.9661.7413.9350.8332.57825.92
    73 nm0.8054.1914.2790.2176.06861.00
    105 nm0.8423.7764.4910.5055.20352.31
    255.33 nm0.0139.426349.0310.0156.94069.77
    45 nm0.9621.8499.1840.9062.25822.70
    73 nm0.8104.13912.7020.0287.83878.80
    105 nm0.8543.62112.3370.5406.01060.42
    Table 1. Effect of univariate model enhanced by different size gold nanoparticles
    样品设备浓度/(mg·kg-1)分析方法ARP/%RSDP/%参考文献
    生物炭单脉冲LIBS<30.42EN-SVR5.4011.09本文
    土壤辉光放电LIBS<333 000单变量校正法-8[12]
    肥料单脉冲LIBS<200 000单变量校正法15-[13]
    Table 2. Comparison of the results of LIBS calibration model for phosphorus in related literatures
    Mei GUO, Ruo-yu ZHANG, Rong-guang ZHU, Hong-wei DUAN. Quantitative Determination of Water-Soluble P in Biochar Based on NELIBS Technology and EN-SVR Model[J]. Spectroscopy and Spectral Analysis, 2021, 41(7): 2301
    Download Citation