
Tao Yang, Jun Han, Haiyan Jiang. Skeleton Action Recognition Based on Dense Residual Shift Graph Convolutional Network[J]. Laser & Optoelectronics Progress, 2023, 60(10): 1010012
- Laser & Optoelectronics Progress
- Vol. 60, Issue 10, 1010012 (2023)
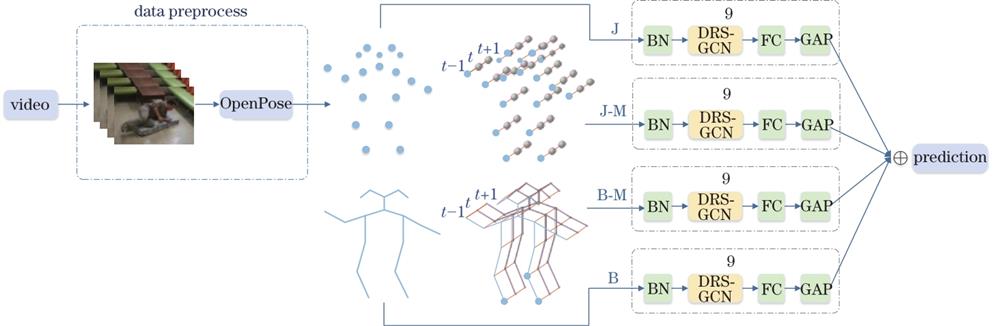
Fig. 1. Diagram of system block

Fig. 2. Shift convolution operation. (a) Node 1 shift; (b) node 2 shift; (c) feature map after shift
Fig. 3. Diagram of DRS-GCN block
Fig. 4. Diagrams of dense residual network structure. (a) Residual connection; (b) dense connection; (c) dense residual connection
Fig. 5. Diagram of joint-motion
Fig. 6. Examples of DAILY dataset. (a) Walking; (b) throwing; (c) falling
Fig. 7. Node labeling of OpenPose
Fig. 8. Examples of skeleton diagram. (a) Walking; (b) throwing; (c) falling
Fig. 9. Confusion matrix of multi-class
Fig. 10. Curves of training accuracy and loss value on DAILY dataset. (a) Accuracy; (b) loss value
Fig. 11. Curves of training accuracy and loss value on NTU60 RGB+D dataset (CS). (a) Accuracy of CS; (b) loss value of CS
Fig. 12. Curves of training accuracy and loss value on NTU60 RGB+D dataset.(CV). (a) Accuracy of CV; (b) loss value of CV
|
Table 1. Research on performance of multi-stream network on NTU60 RGB+D dataset
| |||||||||||||||||||||||||||||||||||||||||||||||||||||
Table 2. Experimental data comparison of 7 behaviors on DAILY dataset
|
Table 3. Comparative analysis of three indicators on DAILY dataset
| ||||||||||||||||||||||||||||||||||||||
Table 4. Comparison of experimental data between DRS-GCN and advanced algorithms on NTU60 RGB+D dataset

Set citation alerts for the article
Please enter your email address
© Copyright 2018-2021 | Chinese Laser Press. All Rights Reserved 沪ICP备15018463号-20