• Laser & Optoelectronics Progress
  • Vol. 58, Issue 9, 0907001 (2021)
Hailong Du1、*, Zhaobin Duan1, and Xiaodong Sun2
Author Affiliations
  • 1Engineering Techniques Training Center National Experimental Teaching Demonstrating Center, Civil Aviation University of China, Tianjin 300300, China
  • 2School of Electrical and Electronic Engineering, Tiangong University, Tianjin 300387, China
  • show less
    DOI: 10.3788/LOP202158.0907001 Cite this Article Set citation alerts
    Hailong Du, Zhaobin Duan, Xiaodong Sun. White Light Interference Signal Processing Method Based on Fourier Frequency Spectrum Analysis[J]. Laser & Optoelectronics Progress, 2021, 58(9): 0907001 Copy Citation Text show less
    Schematic of white light interferometer imaging
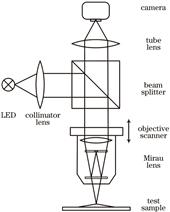
    Fig. 1. Schematic of white light interferometer imaging
    White light interference signal under illumination of white light LED. (a) Frequency-spectrum of interference signal; (b) white light interference signal
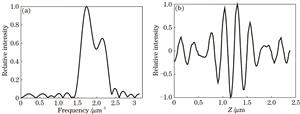
    Fig. 2. White light interference signal under illumination of white light LED. (a) Frequency-spectrum of interference signal; (b) white light interference signal
    White light interference signal and envelope curves of signals in different frequency bands
    Fig. 3. White light interference signal and envelope curves of signals in different frequency bands
    Frequency-spectrum parameters and surface roughness under different energy ratios. (a) Relationship between wavenumber interval and energy ratio; (b) relationship between surface arithmetic mean height and energy ratio
    Fig. 4. Frequency-spectrum parameters and surface roughness under different energy ratios. (a) Relationship between wavenumber interval and energy ratio; (b) relationship between surface arithmetic mean height and energy ratio
    Relationship between cost function value and energy ratio
    Fig. 5. Relationship between cost function value and energy ratio
    Surface measurement results of silver mirror. (a)(b) Twice repeated measurements of the same area; (c) profile of two measurements at Y=174 µm; (d) deviation curve between the average value and the profile at Y=174 µm
    Fig. 6. Surface measurement results of silver mirror. (a)(b) Twice repeated measurements of the same area; (c) profile of two measurements at Y=174 µm; (d) deviation curve between the average value and the profile at Y=174 µm
    Step structure measurement result. (a) Three-dimensional topography of step structure; (b) profile of step structure at Y=174 µm
    Fig. 7. Step structure measurement result. (a) Three-dimensional topography of step structure; (b) profile of step structure at Y=174 µm
    Energy ratioLower limit of wavenumber /µm-1Upper limit of wavenumber /µm-1Sa,avg /nmSa,var /nm2Cost function value
    0.6001.59511.90433.55980.01230.0439
    0.7041.55921.99873.09790.01140.0221
    0.8001.58852.12892.27920.00280.0063
    0.9041.57232.21681.89760.00050.0010
    0.9841.46812.35351.72000.00040.0007
    0.9920.95053.13482.63480.01280.0338
    10253.48320.09070.3161
    Table 1. Experimental data of several energy ratios
    Hailong Du, Zhaobin Duan, Xiaodong Sun. White Light Interference Signal Processing Method Based on Fourier Frequency Spectrum Analysis[J]. Laser & Optoelectronics Progress, 2021, 58(9): 0907001
    Download Citation