
Xiangjun Wang, Hui Zhu. High frame rate target tracking method using domestic FPGA[J]. Infrared and Laser Engineering, 2023, 52(9): 20220905
- Infrared and Laser Engineering
- Vol. 52, Issue 9, 20220905 (2023)
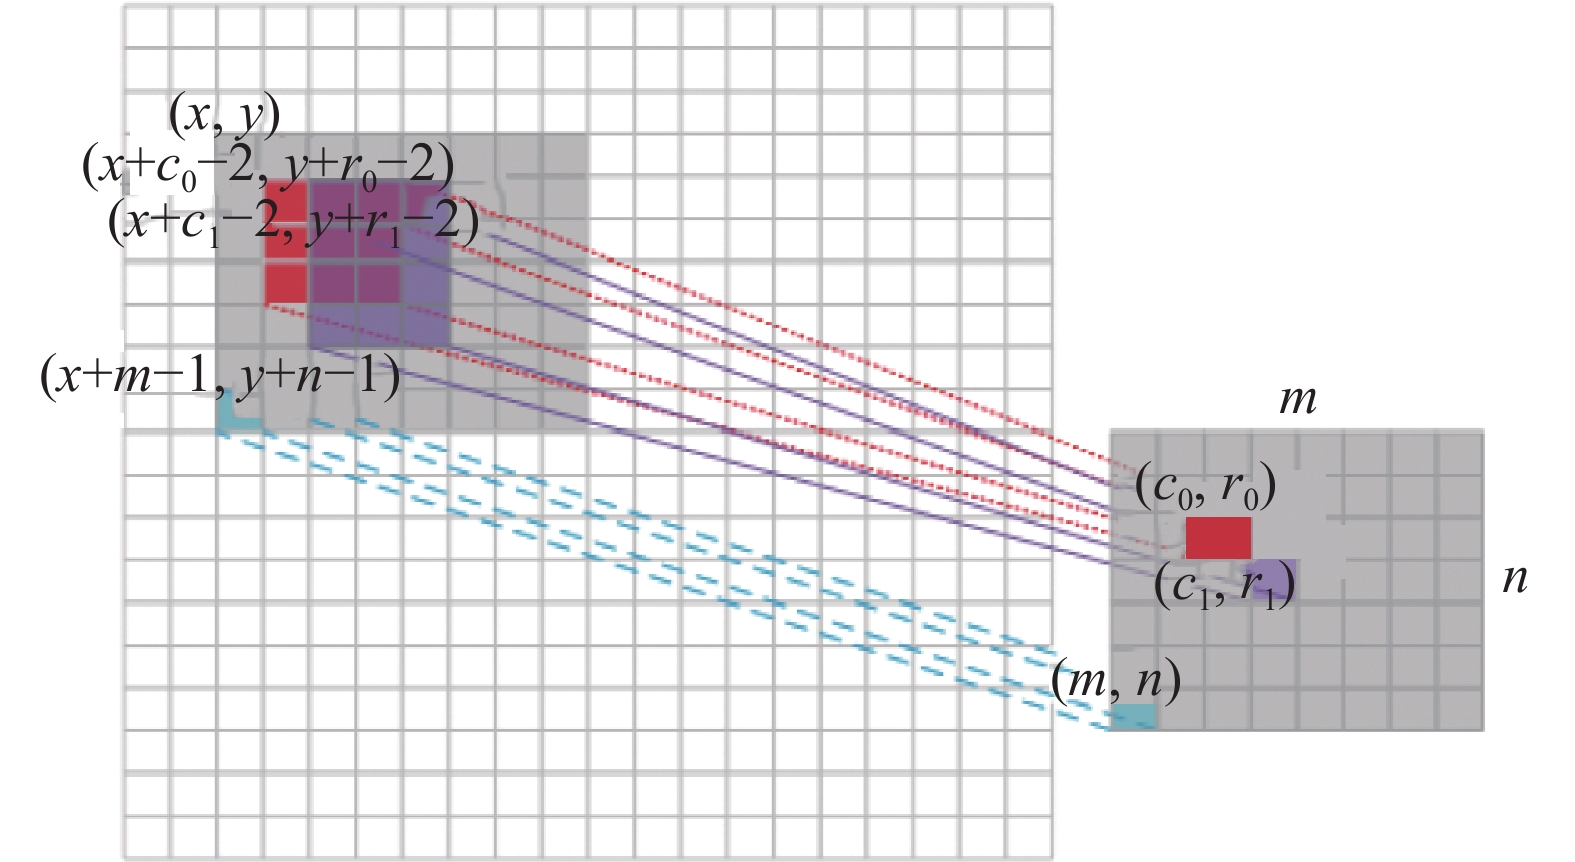
Fig. 1. Schematic diagram of SMAD method
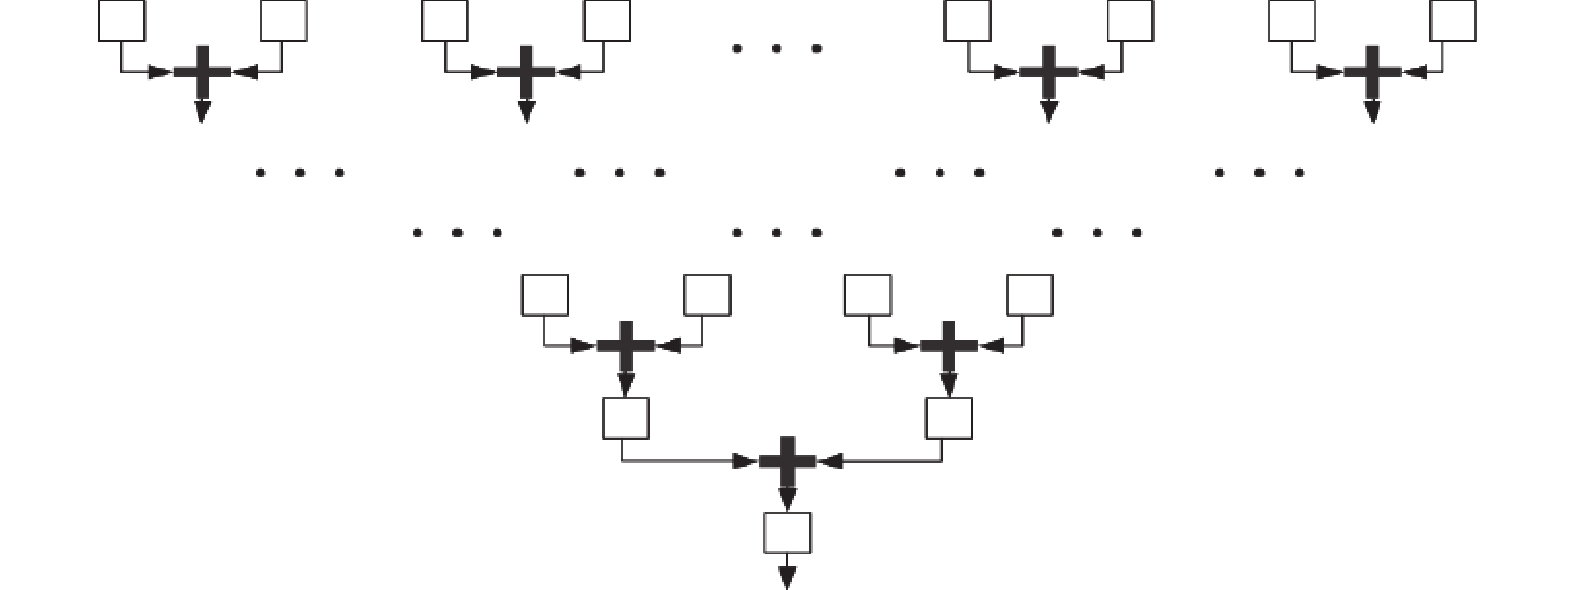
Fig. 2. Multistage pipelined adder
Fig. 3. Comparison before and after optimization of SMAD method
Fig. 4. Pyramid-like strategy
Fig. 5. Structural diagram of the target tracking platform
Fig. 6. Hardware architecture for maximum and minimum filtering
Fig. 7. Flowchart of the target search module
Fig. 8. Comparison of tracking indicators between SMAD and SAD
Fig. 9. Scale switching of the template
Fig. 10. Performance comparison of each template matching algorithm tracking the car sequence
Fig. 11. Functional simulation waveform of the target tracking module
Fig. 12. Tracking experiment for a target tracking system
Fig. 13. Anti-occlusion test of target tracking system
|
Table 1. Comparison of domestic and foreign FPGAs
| |||||||||||||||||||||||||||||||||||||||||||||||||||||||||||||||||||||||||||||||||||||||
Table 2. Comparison of metrics for each tracking algorithm
|
Table 3. Resource consumption of the FPGA

Set citation alerts for the article
Please enter your email address
© Copyright 2018-2021 | Chinese Laser Press. All Rights Reserved 沪ICP备15018463号-20