
Fajun Xiao, Guanglin Wang, Xuetao Gan, Wuyun Shang, Shiyin Cao, Weiren Zhu, Ting Mei, Malin Premaratne, Jianlin Zhao. Selective excitation of a three-dimensionally oriented single plasmonic dipole[J]. Photonics Research, 2019, 7(6): 693
- Photonics Research
- Vol. 7, Issue 6, 693 (2019)
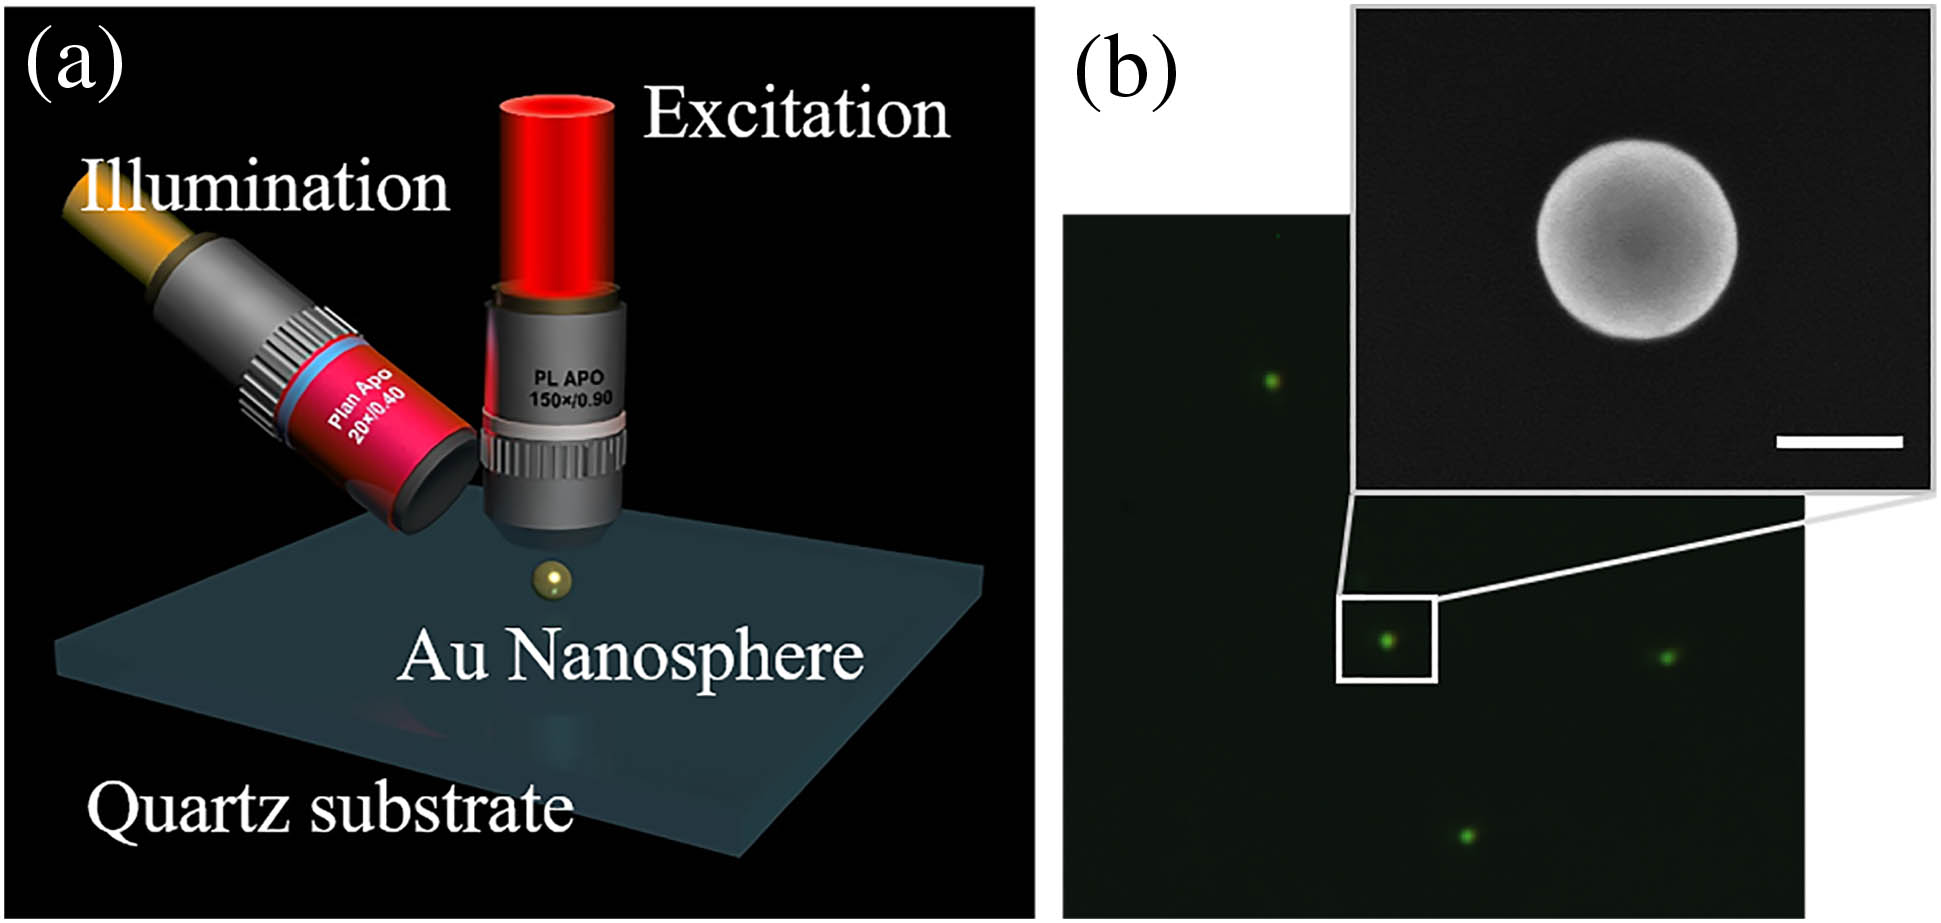
Fig. 1. (a) Schematic of electric dipole excitation in Au nanospheres with a backscattering configuration where the excitation is focused onto the sample via a 150 × 20 ×
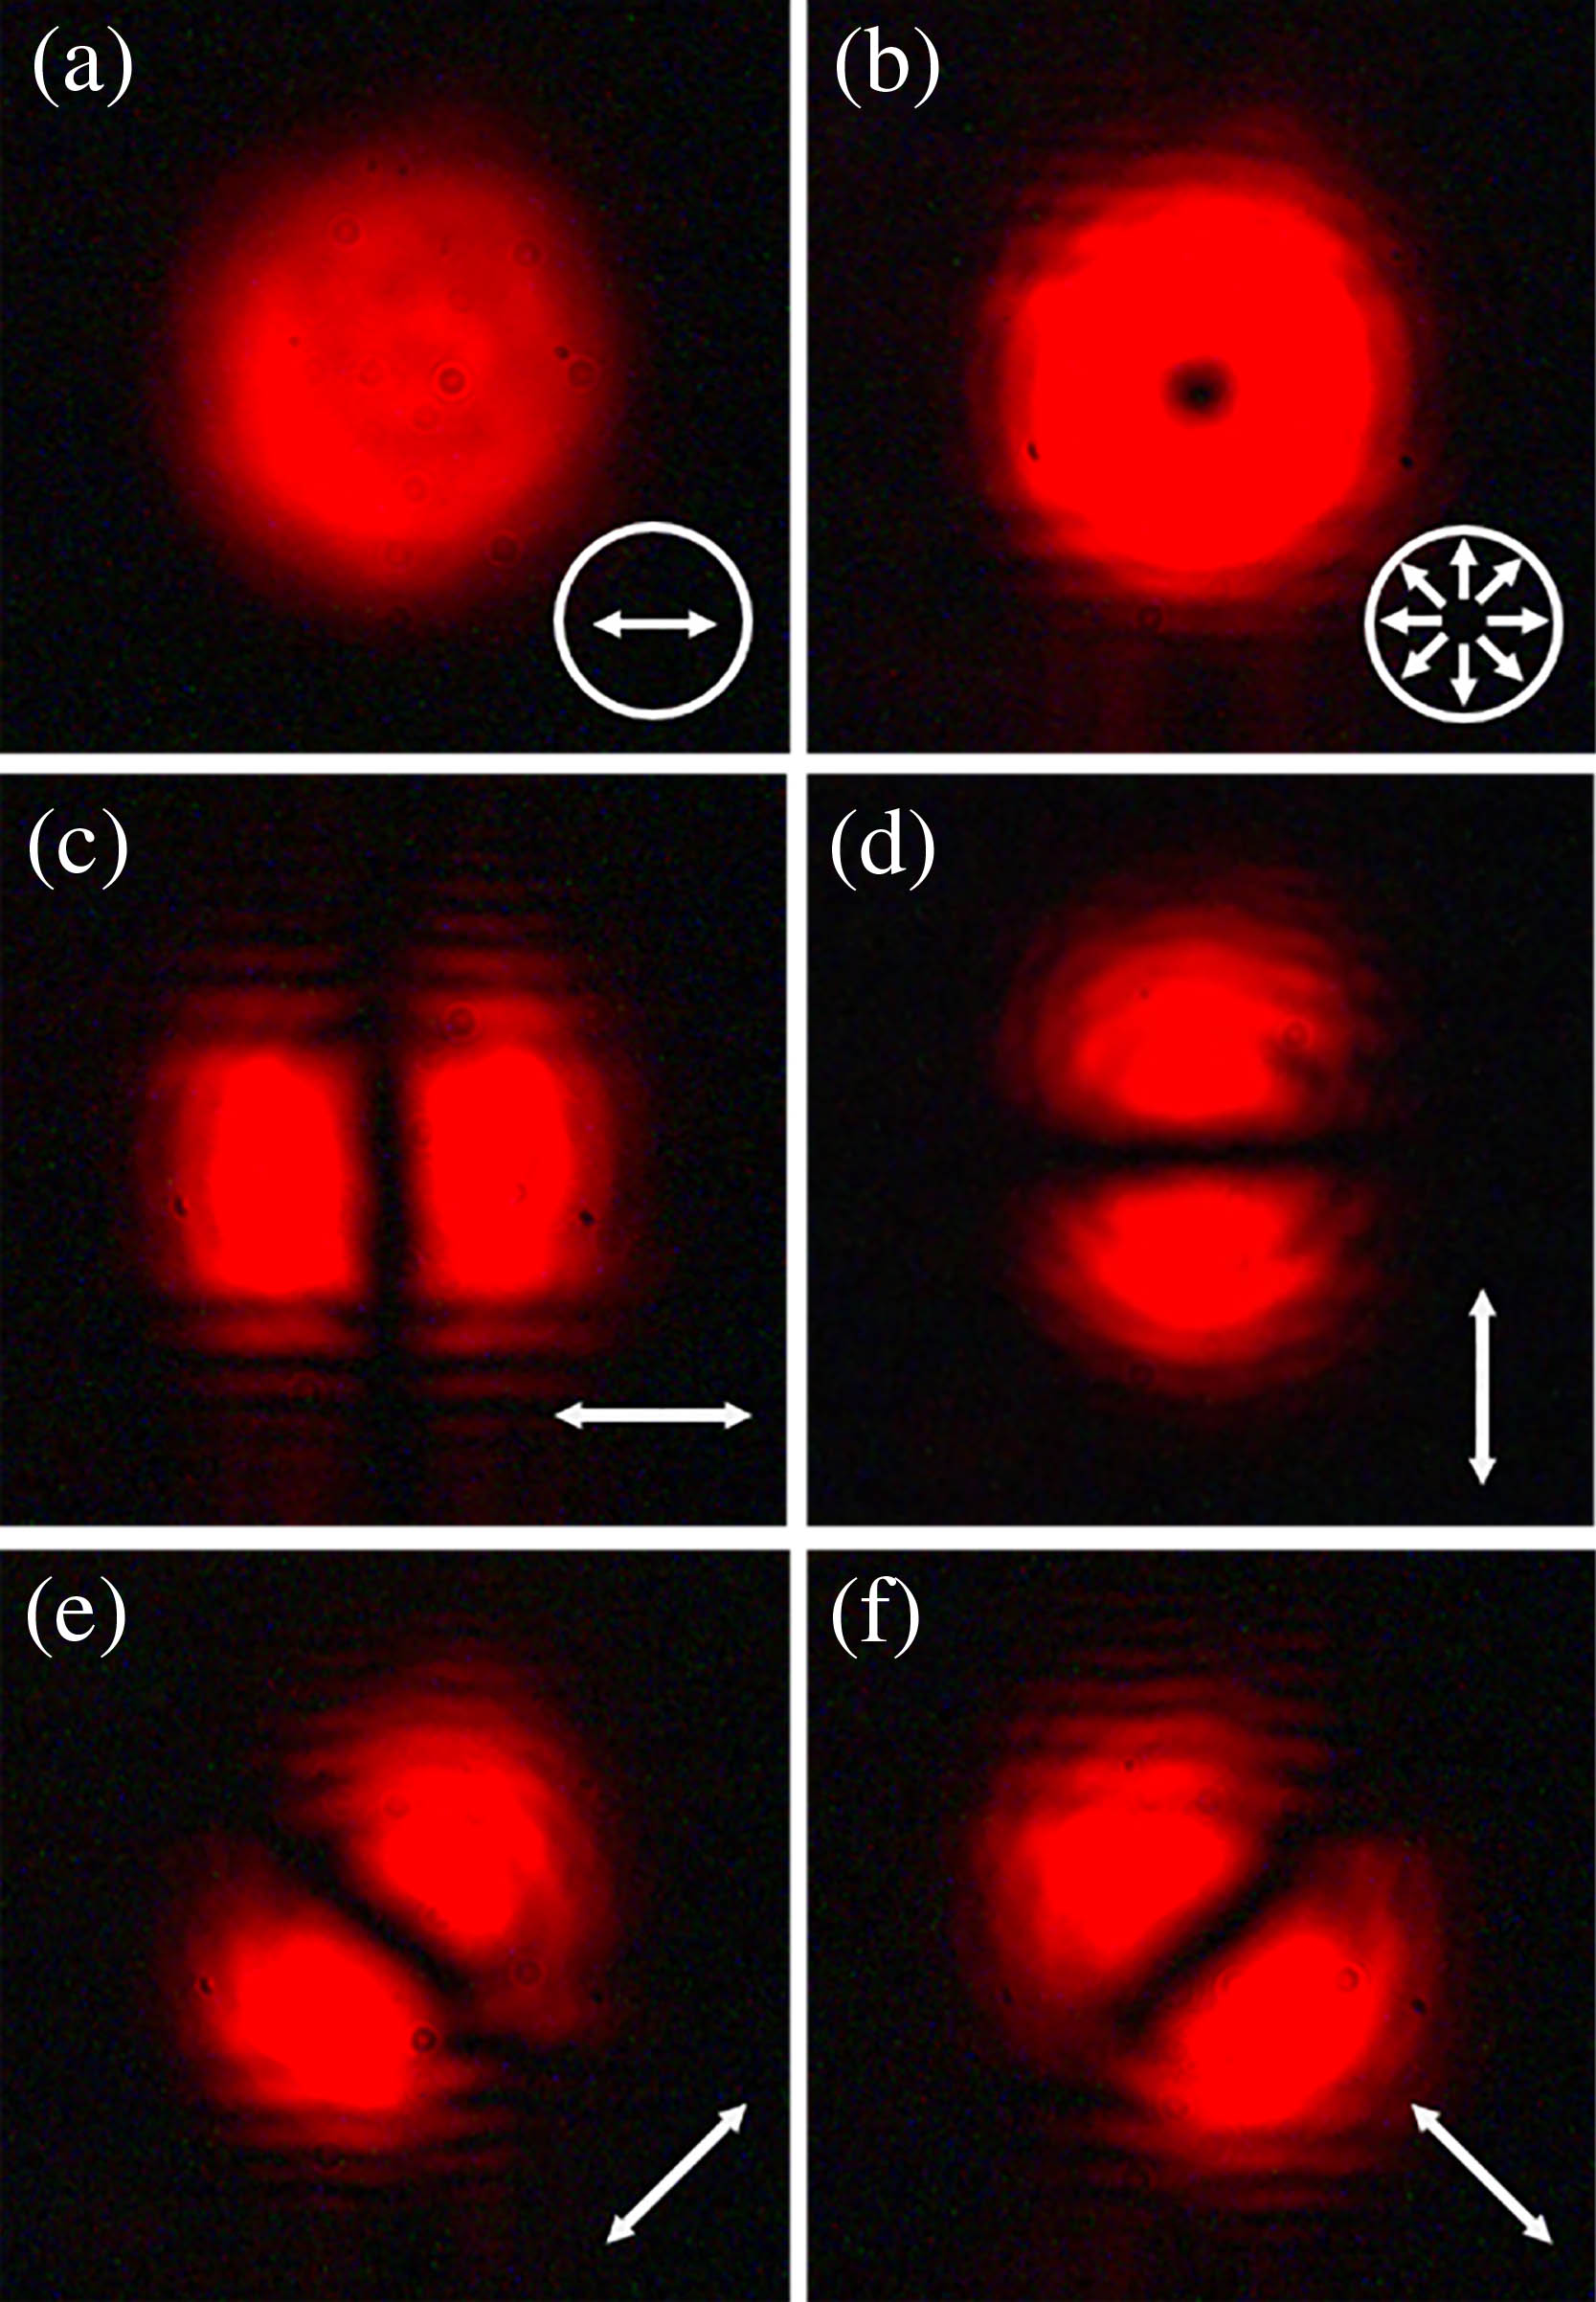
Fig. 2. Intensity distributions of (a) linearly polarized Gaussian and (b) radially polarized beams at the wavelength of 633 nm, where the insets indicate the polarization states of the beams. Intensity profiles of the radially polarized beam after passing an analyzer orientated along (c) horizontal, (d) vertical, (e) diagonal, and (f) antidiagonal directions.
Fig. 3. (a) Scattering spectra of individual Au nanospheres excited by a linearly polarized Gaussian beam. From top to bottom, nanospheres have radii of 50 nm, 60 nm, 70 nm, 80 nm, and 90 nm. The left and right columns correspond to the experimental and simulation spectra, respectively. The SEM images of the corresponding Au nanospheres are shown in the middle column, where the scale bar is 100 nm. (b) Scattering spectra of Au nanospheres with different radii calculated from Mie theory, where the crossings represent the resonance wavelengths determined by experimental results in (a), and the inset is the charge distribution of the Au nanosphere (r = 80 nm
Fig. 4. (a) Radially polarized beam-excited scattering spectra of individual Au nanospheres with radii of 50 nm, 60 nm, 70 nm, 80 nm, and 90 nm (from top to bottom). The left and right columns correspond to the experimental and simulation spectra, respectively. The middle column is the SEM images of the corresponding Au nanospheres, where the scale bar is 100 nm. (b) Scattering spectra calculated from Mie theory for Au nanospheres with different radii, where the crossings represent the resonance wavelengths determined by experimental results in (a), and the inset is the charge distribution of the Au nanosphere (r = 80 nm
Fig. 5. (a) Intensity distribution of the tightly focused radially polarized beam at the x z z = 0 nm r = 80 nm x = 0 x = 0

Set citation alerts for the article
Please enter your email address
© Copyright 2018-2021 | Chinese Laser Press. All Rights Reserved 沪ICP备15018463号-20