Abstract
We experimentally demonstrate a scheme to deterministically excite a three-dimensionally oriented electric dipole in a single Au nanosphere by using a tightly focused radially polarized beam whose focal field possesses polarization states along three-dimensional (3D) orientations owing to the spatial overlap between longitudinal and radial electric field components. Experiment observations indicate that the orientation of an excited dipole moment gradually changes from out-of-plane to in-plane when the nanosphere is moved away from the beam center, which is reconfirmed by full-wave simulations. Moreover, rigorous calculation based on Mie theory reveals that a reduced effective ambient permittivity accompanies the rotation of the dipole moment, leading to a blue-shifted and narrowed resonance peak. We envision that our results could find applications in detecting the 3D orientation of isolated molecules and benefit the fine manipulation of light–matter interactions at the single-molecule level.1. INTRODUCTION
Localized surface plasmon resonances result from the collective oscillations of conduction electrons at metal–dielectric interfaces [1]. They can strongly couple with light to produce very intense electromagnetic fields in nano-volumes, enabling various intriguing applications, such as surface-enhanced spectroscopy [2–4], photovoltaics [5], photocatalysis [6], and biosensing [7]. Among many known plasmonic nanostructures, Au nanospheres are of particular interest due to their perfect geometrical symmetry, easy preparation, and well-defined and highly tunable electromagnetic responses [8]. It has been demonstrated that Au nanospheres can function as optical nanoantennas to effectively concentrate far-field energy into nanoscale, which provides an ideal platform for light–matter interactions [9–11]. Moreover, Au nanospheres can readily inter-couple with an ultra-smooth Au film to form a nanocavity with an electric field enhancement factor in excess of three orders of magnitude, facilitating strong light–matter interactions even down to the single molecular level [12–14].
Generally, optical responses of single nanocrystals or molecules are governed by their transition dipoles [15–18]. Taking fluorescence for example, the signals from the single emitters, such as molecule dyes, are proportional to , where is the molecular transition dipole moment and is the excitation electric field at the location of the molecule [19,20]. It is very clear from this result that the molecule response is maximum when its transition dipole moment is parallel to the electrical field, and nullified when they are orthogonal. As a result, the fluorescence signal is quite sensitive to the orientation of the adjacent plasmonic dipole [21,22]. On the other hand, a plasmonic dipole with a configurable orientation is highly desired to map the orientation of a molecular transition dipole to acquire the intrinsic structural and optical properties of a molecule. Routinely, a normally incident linearly polarized beam is used for exciting plasmonic dipoles, which are intrinsically constrained to in-plane orientations. Even though it is possible to illuminate a metallic particle by an oblique incident light to induce a vertical dipole moment [23,24], exciting the single plasmonic dipole with an arbitrary orientation still remains challenging.
Recent advances in generating cylindrical vector beams provide ways to spatially modulate inhomogeneous states of polarization almost at will [25,26]. Especially, one can readily control the polarization distribution of a tightly focused cylindrical vector beam through phase modulation [27], providing a versatile excitation scheme for plasmonic modes [28–31]. For example, tightly focused radially polarized beams have been successfully utilized to excite the “dark” mode of an Au heptamer via spatially matching the excitation field with the dipole moment of the dark mode [28,29]. In this paper, we propose a strategy to excite an arbitrarily oriented plasmonic dipole in an Au nanosphere by employing a tightly focused radially polarized beam. The superposition between the longitudinal and radial electric field components of the excitation results in position-related three-dimensionally distributed polarization states at the focal plane. Therefore, successful excitations of plasmonic dipoles along arbitrary orientations can be achieved by moving the Au nanosphere to different locations on the focal plane of the radially polarized beam. Our results open up a new possibility to make an Au nanosphere function as a flexible local probe to explore the light–matter interactions at the single-molecule level, thus potentially spawning applications in high-resolution confocal fluorescence polarization microscopy.
Sign up for Photonics Research TOC. Get the latest issue of Photonics Research delivered right to you!Sign up now
2. EXPERIMENTAL AND NUMERICAL SECTIONS
Individual Au nanospheres are deposited onto a quartz substrate by spin-coating a colloidal Au solution (radius , NanoSeedz). The resulting sample is monitored by a home-built dark-field microscope, as illustrated in Fig. 1(a), where white light from a tungsten halogen lamp illuminates nanospheres through a objective (Mitutoyo, NA 0.4) at an incident angle of 60°, and then the scattering light is collected with a objective (Leica, NA 0.9) to image on a CCD camera. Figure 1(b) shows a typical dark-field image of the sample. As seen, Au nanospheres are well separated to allow single particle measurement. The particle size is further characterized by a scanning electron microscope (SEM). The acquired image is shown in the magnified view in Fig. 1(b).
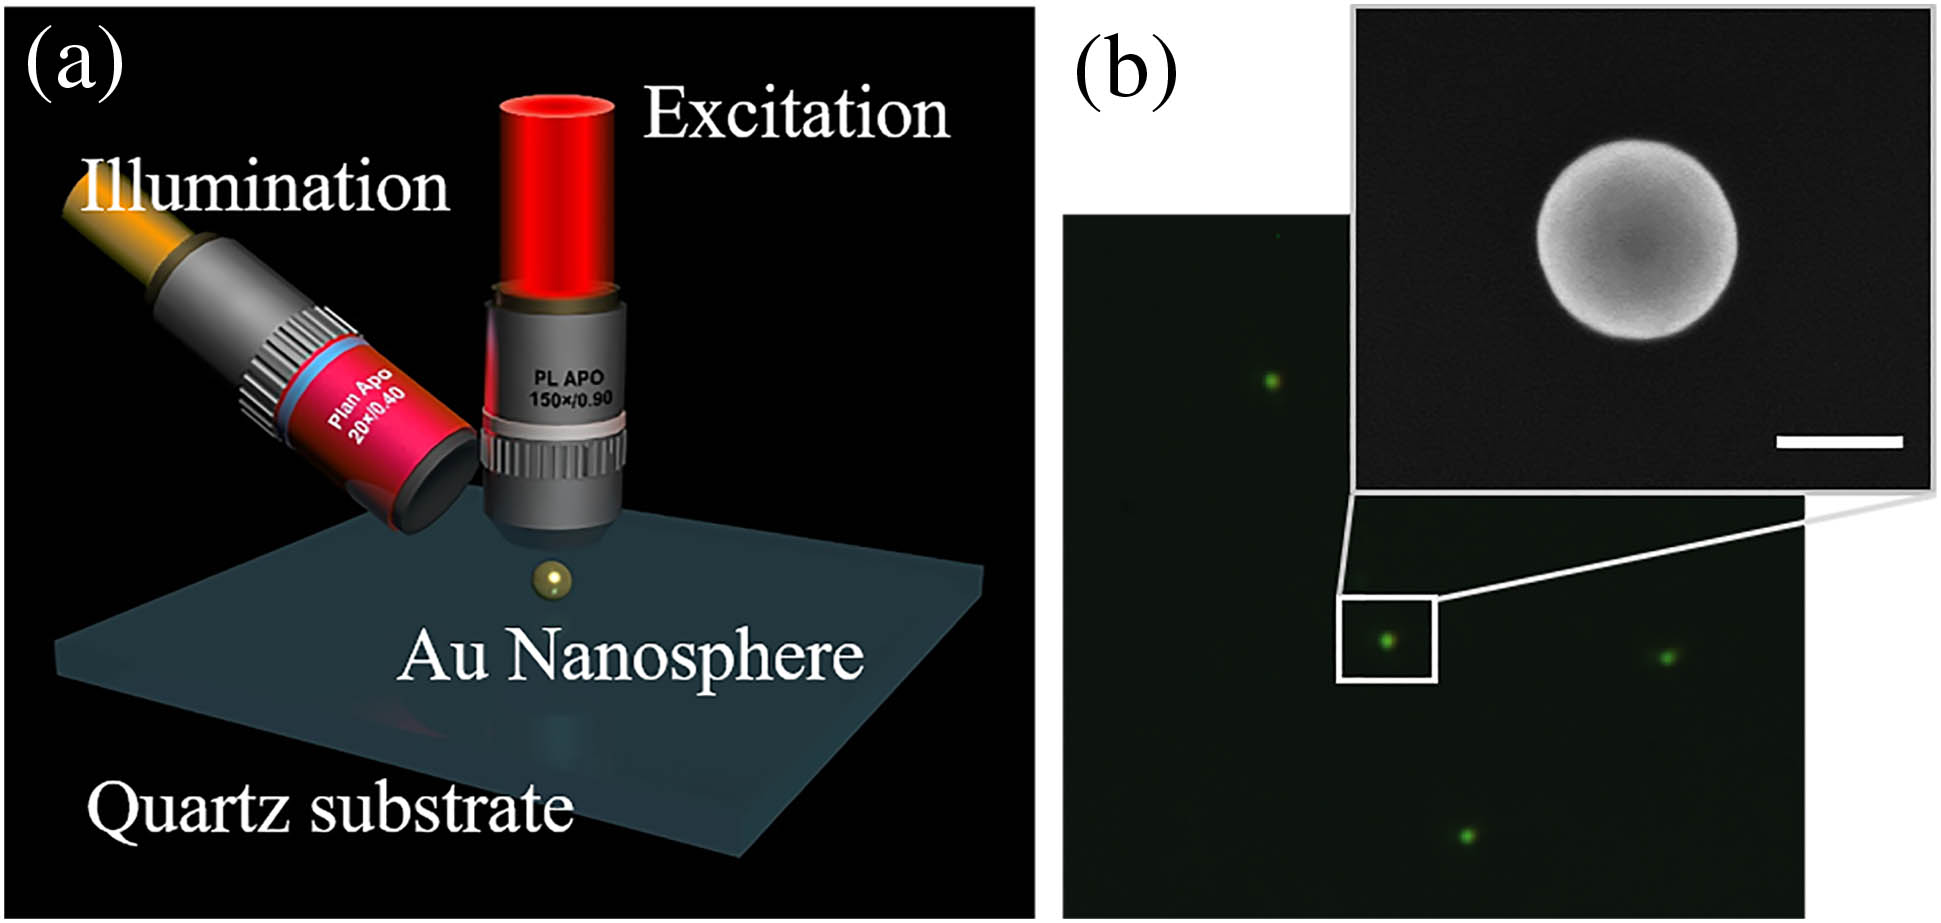
Figure 1.(a) Schematic of electric dipole excitation in Au nanospheres with a backscattering configuration where the excitation is focused onto the sample via a objective and white light is focused through a objective as the side illumination of dark field setup. (b) Dark-field image of Au nanospheres with a radius of 80 nm and a typical zoom-in SEM image, where the scale bar is 100 nm.
We use a supercontinuum laser (Fianium SC400-4), focused through the objective in Fig. 1(a), to excite a plasmonic dipole in the Au nanosphere. The scattering spectra of nanospheres are measured in backscattering configuration, where the scattering light is collected with the same objective and analyzed by a spectrometer (Andor SR-303i equipped with a Newton 920 CCD camera). The recorded spectra are adjusted against the spectral profile of the excitation , which is acquired by swapping the sample with a mirror. In addition, the background spectra are taken on the quartz substrate away from the Au nanospheres. The final scattering spectra of Au nanospheres are calculated by invoking the relation [32] The polarization state of excitation can be switched from a linearly polarized Gaussian beam [see Fig. 2(a)] to a radially polarized vector beam [see Fig. 2(b)] by a liquid crystal polarization converter (ARCoptix S. A., Switzerland). The generated vector beam can be analyzed by passing through a polarizer in horizontal, vertical, 45°, and orientations, as shown in Figs. 2(c)–2(f), which confirm the radially polarized state of the vector beam in Fig. 2(b).
To validate the experimental results, we used commercial software based on finite-difference time-domain method (FDTD Solutions, Lumerical Inc., Canada) to simulate the plasmonic responses of Au nanospheres. In our full-wave simulations, the focal field of the radially polarized beam was calculated by MATLAB code based on vector diffraction theory of Richards–Wolf, which was also used in our FDTD solver for implementing the light source [33]. The permittivity of Au was obtained by empirically fitting the experimental data of Johnson and Christy with the multi-coefficient model implemented in the FDTD solver [34]. Throughout the simulation, we assumed that the refractive index of quartz substrate was 1.45. The perfectly matched layers as absorbing boundaries were used to mimic nanoparticles placed in infinitely large free space. We derived the scattering spectra by integrating the scattered electric field intensity over a virtual box enclosing the Au nanoparticle. The charge distribution of the nanosphere was obtained by calculating the difference of the normal component of the electric field above and below the Au surface according to Gauss’s law.

Figure 2.Intensity distributions of (a) linearly polarized Gaussian and (b) radially polarized beams at the wavelength of 633 nm, where the insets indicate the polarization states of the beams. Intensity profiles of the radially polarized beam after passing an analyzer orientated along (c) horizontal, (d) vertical, (e) diagonal, and (f) antidiagonal directions.
3. RESULTS AND DISCUSSION
We begin the scattering spectrum measurements by using a linearly polarized Gaussian beam as the excitation. The spectra of single Au nanospheres with radii in the range of 50–90 nm [see the SEM images in the middle column of Fig. 3(a)] are shown in the left column in Fig. 3(a). The pronounced resonance peaks in these scattering spectra result from the horizontally aligned dipole, which can be examined by a typical surface charge plot in the inset in Fig. 3(b). It is also suggested that the resonance peak of the horizontal dipole has an obvious red-shift and broadening with the increasing of nanosphere radii over the range of 50–90 nm. This dispersion behavior is attributed to the retardation effect [35], which is further confirmed by numerical simulations, as shown in the right column in Fig. 3(a). We also perform a rigorous analytical calculation of scattering spectra of Au nanospheres based on Mie theory. The polarizability of the Au nanoparticle is written as [36] where is the permittivity of Au modeled from the experimental data of Johnson and Christy with polynomial interpolation [34], represents the effective permittivity of the quartz substrate that partially contacts with the Au nanosphere, denotes the wave vector of the excitation, and stands for the volume of the nanosphere. Then, the scattering cross section of the Au nanosphere is written as . Figure 3(b) shows scattering spectra of nanospheres versus particle radii that were calculated by Mie theory, in which the crossings denote the resonance peaks of the particles with the same radii as those in the experiment [shown in Fig. 3(a)]. These analytical predictions show good agreements with experimental results. Moreover, the best fit between Mie scattering calculations and experimental spectra yields an effective of 1.12. Figure 3(c) shows the electric field enhancement maps of Au nanospheres at their resonance wavelengths. It is observed that the electric fields are confined mainly horizontally, in accordance with the orientations of the dipole moments. As indicated by the imaginary term of Eq. (2), the increase in particle size can lead to an increased radiative damping and a decline in the field enhancement [see left to right panels in Fig. 3(c)].
Figure 3.(a) Scattering spectra of individual Au nanospheres excited by a linearly polarized Gaussian beam. From top to bottom, nanospheres have radii of 50 nm, 60 nm, 70 nm, 80 nm, and 90 nm. The left and right columns correspond to the experimental and simulation spectra, respectively. The SEM images of the corresponding Au nanospheres are shown in the middle column, where the scale bar is 100 nm. (b) Scattering spectra of Au nanospheres with different radii calculated from Mie theory, where the crossings represent the resonance wavelengths determined by experimental results in (a), and the inset is the charge distribution of the Au nanosphere (). (c) Electric field enhancement maps of single Au nanospheres with radii from 50 nm to 90 nm (from left to right) at their resonance wavelengths.
Subsequently, we change the excitation to a radially polarized beam. The excited scattering spectra of Au nanospheres with radii in the range of 50–90 nm are displayed in the left column in Fig. 4(a). Notably, for the Au nanosphere with the same radius, the excitation of the tightly focused radially polarized beam red-shifts and broadens the resonance peaks compared with results excited by the Gaussian beam. The right column in Fig. 4(a) shows simulated scattering spectra, which agree well with their corresponding experimental results. The simulated surface charge distributions of nanospheres allow us to identify these resonance modes as vertical dipole modes, as representatively shown in the inset in Fig. 4(b). This mode is commonly absent in the scattering spectrum due to its weak coupling with the light field. However, under the excitation of the tightly focused radially polarized beam, it becomes active because of the considerable longitudinal electric field component at the focal plane. To further reveal the origins of the peak change in Fig. 4(a), we reproduce the experimental scattering spectra with the Mie theory at an effective of 1.65. The results are illustrated in Fig. 4(b), where the crossings represent the resonance peak positions in Fig. 4(a). The theoretical predictions well corroborate experimental results. Because the real and imaginary parts of the denominator in Eq. (2), respectively, determine the resonance wavelength and the radiative damping of the system, the red-shift and broadening of the resonance peak in Fig. 4(a) can be interpreted as the direct consequence of the increased . Physically, the increase of implies an increased screening effect from the substrate, which can quench the restoring force of surface plasmon resonance through the Coulomb repulsive interaction, resulting in the red-shift of resonance wavelength and an increase in the damping rate of plasmon resonance.
Figure 4.(a) Radially polarized beam-excited scattering spectra of individual Au nanospheres with radii of 50 nm, 60 nm, 70 nm, 80 nm, and 90 nm (from top to bottom). The left and right columns correspond to the experimental and simulation spectra, respectively. The middle column is the SEM images of the corresponding Au nanospheres, where the scale bar is 100 nm. (b) Scattering spectra calculated from Mie theory for Au nanospheres with different radii, where the crossings represent the resonance wavelengths determined by experimental results in (a), and the inset is the charge distribution of the Au nanosphere () excited by the radially polarized beam. (c) Electric field enhancement maps of single Au nanospheres with radii of 50 nm, 60 nm, 70 nm, 80 nm, and 90 nm (from left to right) at their resonance wavelengths.
In Fig. 4(c), we depict the electric field enhancement maps of the vertical dipoles with nanosphere radii varying from 50 nm to 90 nm (left to right panels). Owing to the vertical dipole moment, the electric fields are strongly confined in between the nanosphere and substrate. Remarkably, the field enhancement factors are increased by almost three times those of horizontal dipoles with the same particle radii. This can be understood as a result of the increased , which suggests more dielectric screening charges are induced in the substrate, enhancing the electric field intensity.
When subjected to a tight focusing () by the objective, the radially polarized beam leads to a strong longitudinal electric field component sharply centered around the optical axis. Meanwhile, the focal field also has a radial component that has a donut-like intensity distribution with zero amplitude on the optical axis. These two electric field components coherently superpose at the focal plane, resulting in a gradually rotated polarization direction along axis, as illustrated by the green arrows in Fig. 5(a) [also see Fig. 5(d)]. Intuitively, one would expect the dipole moment of Au nanospheres to align along the polarization directions of the focal field when moving the sphere away from the beam center. The left column in Fig. 5(b), top to bottom, displays the scattering spectra of an Au nanosphere () at positions of , 80 nm, 160 nm, 240 nm, and 320 nm. It is found that the resonance peaks get narrower and blue-shift as the nanosphere is scanned along the positive axis. Further simulated spectra also strongly agree with this spectral change, as depicted in the right column in Fig. 5(b). More interestingly, the spectrum change is highly related to charge distribution of the nanosphere, as shown in the top row in Fig. 5(c). Here, we note that the dipole moment of the nanosphere is gradually rotated from out-of-plane (90°) to in-plane (0°) when moved away from the beam center, coinciding with the distribution of polarization state of the focal field. To gain further insight, we invoke Mie theory to fit the scattering spectra in Fig. 5(b). The best fit is achieved at , 1.57, 1.48, 1.25, and 1.12 for the experimental spectra obtained at positions varying from to 320 nm, respectively. Such reduction in ambient permittivity indicates a reduced dielectric screening effect, resulting in the blue-shift of resonance wavelength in Fig. 5(b). According to Eq. (2), this decline of ambient permittivity also weakens the radiative damping, leading to the narrowing of the resonance peak in Fig. 5(b). In addition, the bottom panels in Fig. 5(c) reveal a dramatic decrease of electric field enhancement accompanying the dipole moment rotation, which is interpreted as a consequence of the reduced dielectric screening charges because of the decreased .
Figure 5.(a) Intensity distribution of the tightly focused radially polarized beam at the plane. The green arrows indicate the polarization states around the focal plane (). (b) Evolutions of the scattering spectra of an Au nanosphere () as its location changes from to 320 nm, denoted as the dots in (a). The left and right columns correspond to the experimental and simulation results, respectively. (c) Charge (upper panels) and electric field enhancement maps (lower panels) for the Au nanosphere at positions varying from to 320 nm (from left to right columns). The green arrows denote the orientations of dipole moments. (d) Polarization distributions (green arrows) of the radially polarized beam at its focal plane.
It should be noticed that the tilt angle of the dipole moment, as illustrated in Fig. 5(c), can be precisely controlled by a piezo stage to spatially match the polarization direction of the focal beam. Also, due to the axially symmetric polarization states of the focal field [see Fig. 5(d)], our method can effectively align a plasmonic dipole to any arbitrary direction by controlling the location (, ) of the nanosphere at the focal plane. Such ability to arbitrarily orient a dipole can potentially function as a nanoprobe to obtain the structural, vibrational, and optical properties of the single molecule associated with its transition dipole direction. In particular, fine-tuning the direction of the plasmonic dipole may even acquire the three-dimensional (3D) orientation of the “dark axis” of a single chromophore [19], such as benzene or crystal violet, which possesses a degenerated transition dipole oriented isotropically in a plane. Therefore, we envision the exploitation of this method for far-field polarization microscopy as a powerful tool to characterize physical properties of isolated molecules and their interactions with plasmonic fields.
4. CONCLUSION
In summary, we have proposed a novel method to deterministically rotate a plasmonic dipole with an almost arbitrary 3D orientation by spatially matching the polarization state of a tightly focused radially polarized excitation. The experimental data are in excellent agreement with the full-wave simulations based on FDTD method. Rigorous calculations based on Mie theory reveal that when the dipole rotates from out-of-plane to in-plane, a decrease of effective ambient permittivity occurs, which is responsible for the blue-shift and narrowing of the resonance peak. Our results are applicable for monitoring the orientation of individual molecules, facilitating the study of plasmon–molecule interactions.
Acknowledgment
Acknowledgment. The authors would like to thank the Analytical and Testing Center of Northwestern Polytechnical University for the SEM measurements.
References
[1] M. Premaratne, M. I. Stockman. Theory and technology of SPASERs. Adv. Opt. Photon., 9, 79-128(2017).
[2] K. Kneipp, H. Kneipp, I. Itzkan, R. R. Dasari, M. S. Feld. Ultrasensitive chemical analysis by Raman spectroscopy. Chem. Rev., 99, 2957-2976(1999).
[3] K. Okamoto, I. Niki, A. Shvartser, Y. Narukawa, T. Mukai, A. Scherer. Surface-plasmon-enhanced light emitters based on InGaN quantum wells. Nat. Mater., 3, 601-605(2004).
[4] V. Giannini, A. I. Fernandezdominguez, S. C. Heck, S. A. Maier. Plasmonic nanoantennas: fundamentals and their use in controlling the radiative properties of nanoemitters. Chem. Rev., 111, 3888-3912(2011).
[5] R. Pala, J. S. White, E. S. Barnard, J. S. Q. Liu, M. L. Brongersma. Design of plasmonic thin-film solar cells with broadband absorption enhancements. Adv. Mater., 21, 3504-3509(2009).
[6] X. M. Zhang, Y. L. Chen, R. S. Liu, D. P. Tsai. Plasmonic photocatalysis. Rep. Prog. Phys., 76, 046401(2013).
[7] J. N. Anker, W. P. Hall, O. Lyandres, N. C. Shah, J. Zhao, R. P. Van Duyne. Biosensing with plasmonic nanosensors. Nat. Mater., 7, 442-453(2008).
[8] Q. Ruan, L. Shao, Y. Shu, J. Wang, H. Wu. Growth of monodisperse gold nanospheres with diameters from 20 nm to 220 nm and their core/satellite nanostructures. Adv. Opt. Mater., 2, 65-73(2014).
[9] C. E. Talley, J. B. Jackson, C. Oubre, N. K. Grady, C. W. Hollars, S. M. Lane, T. R. Huser, P. Nordlander, N. J. Halas. Surface-enhanced Raman scattering from individual Au nanoparticles and nanoparticle dimer substrates. Nano Lett., 5, 1569-1574(2005).
[10] S. Palomba, L. Novotny. Near-field imaging with a localized nonlinear light source. Nano Lett., 9, 3801-3804(2009).
[11] J. Butet, J. Duboisset, G. Bachelier, I. Russierantoine, E. Benichou, C. Jonin, P. O. Brevet. Optical second harmonic generation of single metallic nanoparticles embedded in a homogeneous medium. Nano Lett., 10, 1717-1721(2010).
[12] C. Ciraci, R. T. Hill, J. J. Mock, Y. A. Urzhumov, A. I. Fernandezdominguez, S. A. Maier, J. B. Pendry, A. Chilkoti, D. R. Smith. Probing the ultimate limits of plasmonic enhancement. Science, 337, 1072-1074(2012).
[13] F. Benz, M. K. Schmidt, A. Dreismann, R. Chikkaraddy, Y. Zhang, A. Demetriadou, C. Carnegie, H. Ohadi, B. De Nijs, R. Esteban. Single-molecule optomechanics in “picocavities”. Science, 354, 726-729(2016).
[14] R. Chikkaraddy, B. De Nijs, F. Benz, S. J. Barrow, O. A. Scherman, E. Rosta, A. Demetriadou, P. T. Fox, O. Hess, J. J. Baumberg. Single-molecule strong coupling at room temperature in plasmonic nanocavities. Nature, 535, 127-130(2016).
[15] B. Sick, B. Hecht, L. Novotny. Orientational imaging of single molecules by annular illumination. Phys. Rev. Lett., 85, 4482-4485(2000).
[16] I. Chung, K. T. Shimizu, M. G. Bawendi. Room temperature measurements of the 3D orientation of single CdSe quantum dots using polarization microscopy. Proc. Natl. Acad. Sci. USA, 100, 405-408(2003).
[17] H. G. Frey, S. Witt, K. Felderer, R. Guckenberger. High-resolution imaging of single fluorescent molecules with the optical near-field of a metal tip. Phys. Rev. Lett., 93, 200801(2004).
[18] M. Ohmachi, Y. Komori, A. H. Iwane, F. Fujii, T. Jin, T. Yanagida. Fluorescence microscopy for simultaneous observation of 3D orientation and movement and its application to quantum rod-tagged myosin V. Proc. Natl. Acad. Sci. USA, 109, 5294-5298(2012).
[19] S. A. Empedocles, R. Neuhauser, M. G. Bawendi. Three-dimensional orientation measurements of symmetric single chromophores using polarization microscopy. Nature, 399, 126-130(1999).
[20] C. Van Vlack, P. T. Kristensen, S. Hughes. Spontaneous emission spectra and quantum light-matter interactions from a strongly coupled quantum dot metal-nanoparticle system. Phys. Rev. B, 85, 075303(2012).
[21] S. Kuhn, U. Hakanson, L. Rogobete, V. Sandoghdar. Enhancement of single-molecule fluorescence using a gold nanoparticle as an optical nanoantenna. Phys. Rev. Lett., 97, 017402(2006).
[22] T. Ming, H. Chen, R. Jiang, Q. Li, J. Wang. Plasmon-controlled fluorescence: beyond the intensity enhancement. J. Phys. Chem. Lett., 3, 191-202(2012).
[23] M. W. Knight, Y. Wu, J. B. Lassiter, P. Nordlander, N. J. Halas. Substrates matter: influence of an adjacent dielectric on an individual plasmonic nanoparticle. Nano Lett., 9, 2188-2192(2009).
[24] G. Li, Y. Zhang, D. Y. Lei. Hybrid plasmonic gap modes in metal film-coupled dimers and their physical origins revealed by polarization resolved dark field spectroscopy. Nanoscale, 8, 7119-7126(2016).
[25] X. Wang, Y. Li, J. Chen, C. Guo, J. Ding, H. Wang. A new type of vector fields with hybrid states of polarization. Opt. Express, 18, 10786-10795(2010).
[26] S. Liu, P. Li, T. Peng, J. Zhao. Generation of arbitrary spatially variant polarization beams with a trapezoid Sagnac interferometer. Opt. Express, 20, 21715-21721(2012).
[27] H. Wang, L. Shi, B. Lukyanchuk, C. J. R. Sheppard, C. T. Chong. Creation of a needle of longitudinally polarized light in vacuum using binary optics. Nat. Photonics, 2, 501-505(2008).
[28] S. Jager, A. M. Kern, M. Hentschel, R. Jager, K. Braun, D. Zhang, H. Giessen, A. J. Meixner. Au nanotip as luminescent near-field probe. Nano Lett., 13, 3566-3570(2013).
[29] A. Yanai, M. Grajower, G. M. Lerman, M. Hentschel, H. Giessen, U. Levy. Near- and far-field properties of plasmonic oligomers under radially and azimuthally polarized light excitation. ACS Nano, 8, 4969-4974(2014).
[30] F. Xiao, Y. Ren, W. Shang, W. Zhu, L. Han, H. Lu, T. Mei, M. Premaratne, Z. Jianlin. Sub-10 nm particle trapping enabled by a plasmonic dark mode. Opt. Lett., 43, 3413-3416(2018).
[31] J. Sanchoparramon, D. Jelovina. Boosting Fano resonances in single layered concentric core-shell particles. Nanoscale, 6, 13555-13564(2014).
[32] S. Person, M. Jain, Z. J. Lapin, J. J. Saenz, G. W. Wicks, L. Novotny. Demonstration of zero optical backscattering from single nanoparticles. Nano Lett., 13, 1806-1809(2013).
[33] F. Xiao, W. Shang, W. Zhu, L. Han, M. Premaratne, T. Mei, J. Zhao. Cylindrical vector beam-excited frequency-tunable second harmonic generation in a plasmonic octamer. Photon. Res., 6, 157-161(2018).
[34] P. B. Johnson, R. W. Christy. Optical constants of the noble metals. Phys. Rev. B, 6, 4370-4379(1972).
[35] V. Myroshnychenko, J. Rodriguezfernandez, I. Pastorizasantos, A. M. Funston, C. Novo, P. Mulvaney, L. M. Lizmarzan, F. J. G. De Abajo. Modelling the optical response of gold nanoparticles. Chem. Soc. Rev., 37, 1792-1805(2008).
[36] H. Kuwata, H. Tamaru, K. Esumi, K. Miyano. Resonant light scattering from metal nanoparticles: practical analysis beyond Rayleigh approximation. Appl. Phys. Lett., 83, 4625-4627(2003).


