
Ming Fang, Wentao Wang, Zhijun Zhang, Jiansheng Liu, Changhai Yu, Rong Qi, Zhiyong Qin, Jiaqi Liu, Ke Feng, Ying Wu, Cheng Wang, Tao Liu, Dong Wang, Yi Xu, Fenxiang Wu, Yuxin Leng, Ruxin Li, Zhizhan Xu. Long-distance characterization of high-quality laser-wakefield-accelerated electron beams[J]. Chinese Optics Letters, 2018, 16(4): 040201
- Chinese Optics Letters
- Vol. 16, Issue 4, 040201 (2018)
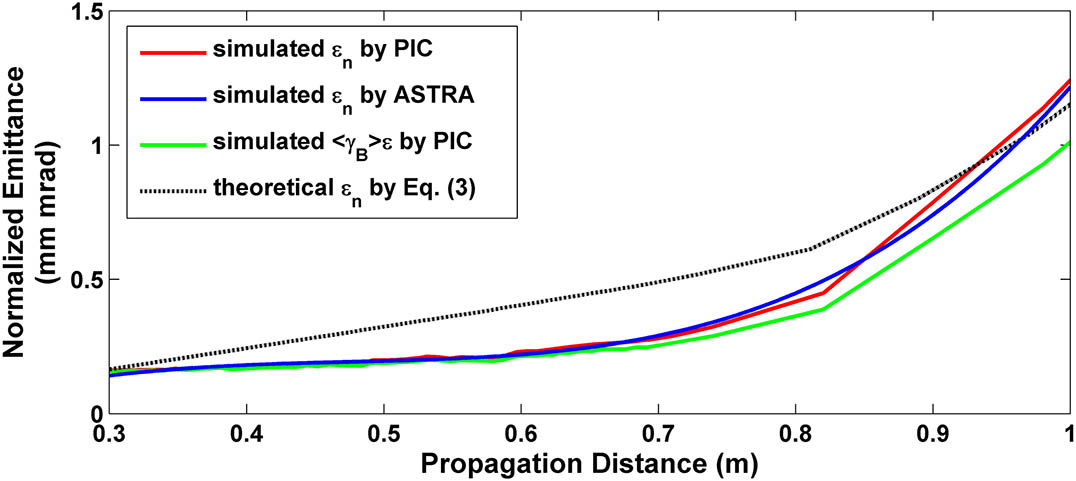
Fig. 1. Transverse normalized emittance evolution along a drift of 1 m downstream of the LWFA source simulated by PIC code (red solid line) and ASTRA code (blue solid line), as well as the theoretical normalized emittance according to Eq. (3 ) (black dotted line). The simulated trace-space emittance ϵ 〈 γ B 〉
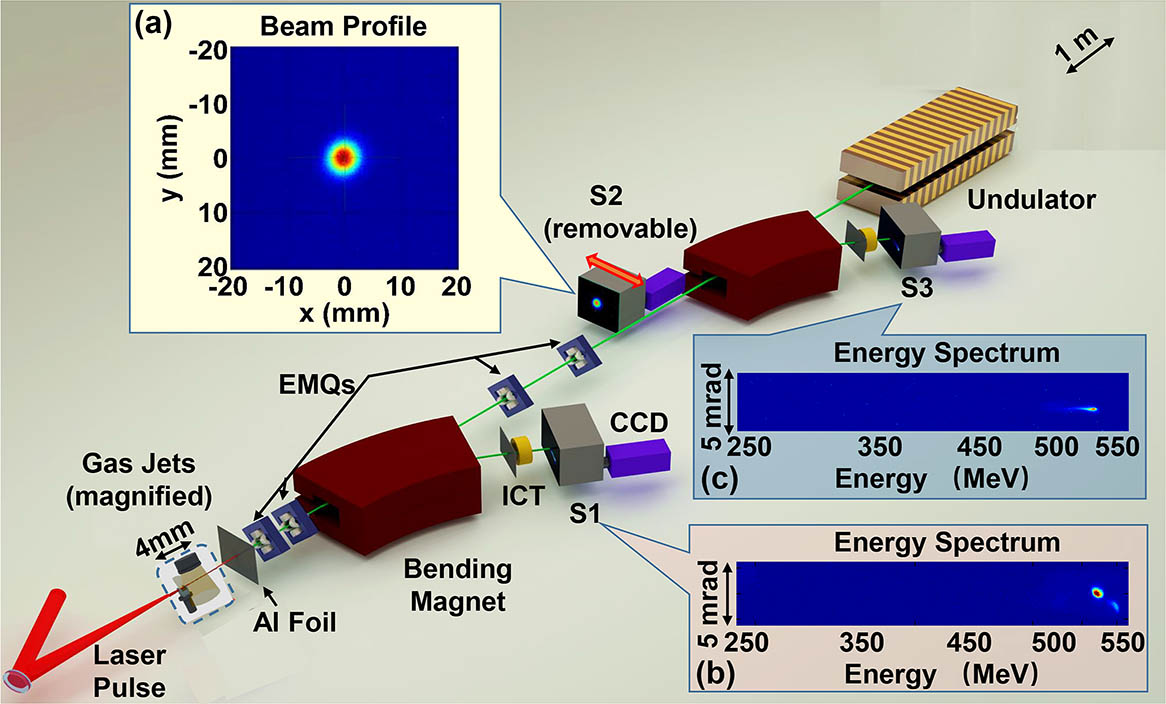
Fig. 2. Layout of the experimental setup for the LWFA-driven beam transport line. Two-stage gas jets are magnified in the dashed box. (a) Typical focused beam profile obtained on the removable phosphor screen (S2) with a peak central energy of 500 MeV. (b) Typical energy spectrum of one e e
Fig. 3. Peak energy (blue) and energy spread (red) measured on S1 against accelerating length. The error bars represent the statistical discrepancy in each direction.
Fig. 4. Raw beam patterns recorded on S2 with different e e
Fig. 5. Tracking simulations of the beam line for experimental beams. (a) Evolution of the horizontal (upper lines) and vertical (lower lines) beam sizes along the longitudinal propagation with the corresponding central energies for beams shown in Figs. 4(b) –4(f) . The shading bands represent the energy spreads. The lattices of the quadrupoles are represented by the blue boxes. (b), (c) Simulated transverse divergence and size at the end of the line as a function of electron energy. The colored shading bands denote the beam energy with corresponding spreads in Figs. 4(b) –4(f) .
Fig. 6. False color images observed on S2. (a) Sum of 29 consecutive 500 MeV e e
|
Table 1. Parameters of the Beam (PIC Simulations)

Set citation alerts for the article
Please enter your email address
© Copyright 2018-2021 | Chinese Laser Press. All Rights Reserved 沪ICP备15018463号-20