Beam quality degradation during the transition from a laser wakefield accelerator to the vacuum is one of the reasons that cause the beam transport distortion, which hinders the way to compact free-electron-lasers. Here, we performed transition simulation to initialize the beam parameters for beam optics transport. This initialization was crucial in matching the experimental results and the designed evolution of the beamline. We experimentally characterized properties of high-quality laser-wakefield-accelerated electron beams, such as transverse beam profile, divergence, and directionality after long-distance transport. By installing magnetic quadrupole lenses with tailored strength gradients, we successfully collimated the electron beams with tunable energies from 200 to 600 MeV.
A laser wakefield accelerator (LWFA) is a potential compact electron accelerator supporting an accelerating gradient of [1]. Electron beams ( beams) generated from this type of accelerator have unique characteristics, such as ultrashort durations of 1–10 fs and high peak currents of 3–10 kA, which enable applications in laboratory-scale laser-driven undulator synchrotron X-ray sources[2] and all-optical free-electron lasers (FELs)[3,4]. However, key problems, such as the substantial shot-to-shot fluctuation, relatively large energy spread, large divergence, and transverse emittance growth during transition[5,6], must be addressed before applying LWFA beams. Recent studies have suggested that tailoring plasma down-ramp profiles can conserve the emittance at the LWFA exit[7], and several studies have presented novel schemes, such as beam decompression[8], the use of a transverse gradient undulator (TGU)[3], and the natural transverse gradient of a laser undulator[9], to compensate for the large energy spread of LWFA beams, whereas these schemes remain at the theoretical and simulation stages possibly because of the limited electron properties of the accelerator or the practical parameter mismatch[7,10].
Applying conventional beam manipulation schemes to the LWFA beams in the experiment is difficult, and one of the possible reasons is that the beam evolves and stretches rapidly downstream with an increase in normalized emittance. Thus, the parameters of the beam after a few distances of free drift at the beamline entrance may differ from those at the positions where the beam just left from the laser-plasma-accelerated region. In previous works, the designed initial parameters for the beamline were mostly set at the LWFA exit[8–10], which might cause the mismatch with the actual parameters of beams in the experiment. Therefore, in this letter, we performed simulations during this transition from the laser-plasma stage to the vacuum stage to initialize the transport. The letter was organized as follows. First, we theoretically analyzed the emittance growth when the beam left the wakefield. Then, we compared simulated beam parameters at the LWFA exit with those 1 m downstream after the transition. We initialized the beam parameters for beam optics transport based on the simulation after the transition as the beam entrance. Next, a combination system of four electromagnetic quadrupole (EMQ) lenses with tailored focusing fields was employed throughout the transport. We then characterized the beam properties after a 10.3-m-long transport from a stable LWFA source[11], including the focused beam profile, beam divergence, and directionality after the long distance. These experimental results agree well with the beam transport simulations.
In the laser-plasma-accelerated region, the strong transverse focusing force limits the electrons to a wake period size of tens of micrometers. Upon entering the vacuum region without the focusing force, the beam is no longer restricted[12] and quickly diverges. Furthermore, the transverse beam emittance tends to increase rapidly during the transition from the plasma field to the vacuum drift stage, because the increasing transverse beam correlation between position and momentum rapidly becomes the predominant term in the emittance due to the transverse phase-space rotation of the electrons[13] and energy deviation[5]. To theoretically describe the emittance evolution in the plasma-vacuum transition stage as a function of the propagation distance, we first present the evolution of the transverse beam size and beam divergence based on Ref. [14] as where is the propagation distance from the exit of the laser-plasma area, is the initial root-mean-square (rms) trace-space, and and are the initial rms transverse size and divergence, respectively, at the exit of LWFA. If we use the second-order statistical average to approximate the particles of the beam coupled with Eqs. (1) and (2), we can write the normalized emittance [14] nearly as where is the rms relative energy spread, is the average relativistic energy factor of the beam, and is the transverse trace-space emittance. Equation (3) is related to the initial beam parameters and the propagation distance from the accelerator. For laser-plasma-accelerated beams, the energy spread is much larger than that in the conventional linac, which should not be neglected. Therefore, as the propagation distance increases, the difference between and will increase.
Sign up for Chinese Optics Letters TOC. Get the latest issue of Chinese Optics Letters delivered right to you!Sign up now
At the LWFA exit, in view of the presence of a beam waist, the correlation between the position and momentum is nearly zero ()[14]; most studies[15,16] approximately estimated the normalized emittance as and regarded it as the initial parameters for the beamline entrance. However, since there are inevitably some distances between the LWFA exit and the beamline entrance, low emittance at the LWFA exit will not be maintained, and the common estimation is inefficient at the entrance of the beam line.
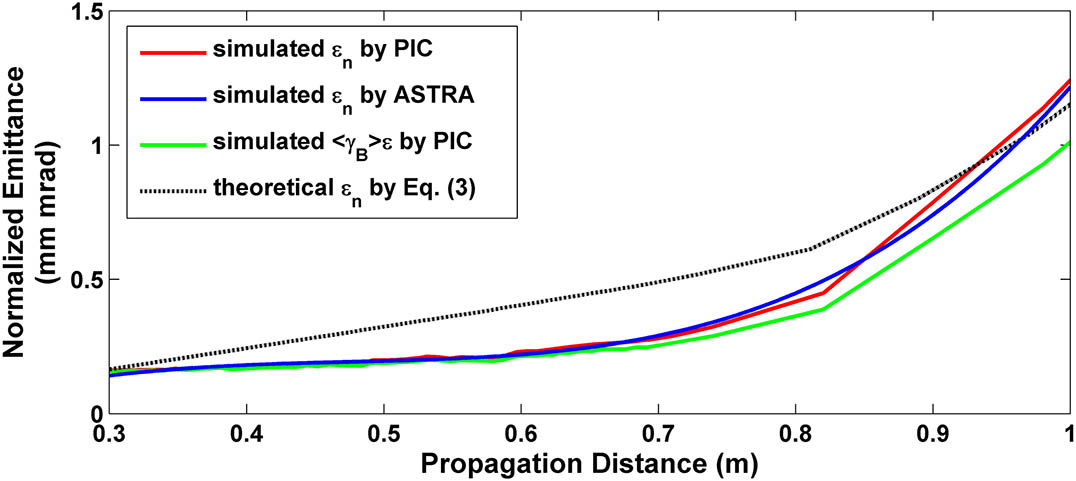
Figure 1 presents a simulation of the emittance evolution with three-dimensional (3D) particle-in-cell (PIC) code from the LWFA stage to the vacuum stage and ASTRA code[17], including the high-order collective effect that is also added. The simulation revealed that the normalized emittances, represented by the red (blue) solid line simulated by the PIC (ASTRA) code, both increased from approximately at the LWFA exit to approximately at 1 m downstream. Comparing with , represented by the green solid line in Fig. 1, demonstrates that the deviation between the two increased, which also confirms that the energy spread and the correlation term [] become the dominating terms of the transverse normalized emittance as the propagation distance increases. The theoretical normalized emittance according to Eq. (3), represented by the black dotted line in Fig. 1, is approximately in accordance with the PIC and ASTRA simulations. The minor deviation between the equation and the simulation might come from the approximation formula with ignored correlations between the longitudinal momentum and the transverse position[5].
Figure 1.Transverse normalized emittance evolution along a drift of 1 m downstream of the LWFA source simulated by PIC code (red solid line) and ASTRA code (blue solid line), as well as the theoretical normalized emittance according to Eq. (3) (black dotted line). The simulated trace-space emittance multiplied by the average relativistic energy factor is shown for comparison (green solid line).
In addition to the emittance, other parameters have also changed along the drift. Table 1 compares the detailed simulated beam parameters from PIC codes that are close to our experimental conditions at two different positions. The first position is the LWFA exit, and the second position is 1 m downstream, which is the entrance of the beamline in our experiment. We only consider the transverse coordinate, because the beam is assumed to feature cylindrical geometry. From Table 1, it is indicated that the beam at the LWFA exit has an ultralow normalized emittance of with a beam transverse size of 0.7 μm and a beam length of 1.8 μm. Whereas at the beamline entrance, the emittance is increased by ten times with the increasing size of 284 μm, and the beam length is also stretched to 2.26 μm. In addition, transverse phase-space rotation of the electrons[5,13] in vacuum will also result in the different phase-space beam distributions between two positions. All of the above have explained that the beam information at the LWFA exit is not supposed to be applied to the beamline entrance anymore[15,16] in order to avoid the mismatch if there are a few distances between two positions. Here, we initialize the particle parameters by using the results of simulation at 1 m downstream as the entrance of beam optics transport.
The layout of the assembled cascaded LWFA-driven beam manipulation line is illustrated in Fig. 2. In the LWFA stage, a 33 fs, 120 TW, 800 nm Ti:sapphire linearly polarized laser pulse[18] was focused onto the structured two-stage He gas jets to generate high-brightness beams[11]. Laser light and plasma emission were blocked by an 80-nm-thick Al foil.
Figure 2.Layout of the experimental setup for the LWFA-driven beam transport line. Two-stage gas jets are magnified in the dashed box. (a) Typical focused beam profile obtained on the removable phosphor screen (S2) with a peak central energy of 500 MeV. (b) Typical energy spectrum of one beam obtained on S1 before manipulation with main peak central energy, rms relative energy spread, and rms divergence of 515 MeV, 1.1%, and 0.24 mrad, respectively. (c) Typical energy spectrum of one beam obtained on S3 after manipulation with main peak central energy, rms relative energy spread, and rms divergence of 517 MeV, 0.9%, and 0.06 mrad, respectively.
In the beam transport stage, four 10 cm EMQs with maximum tunable magnetic field gradients of 80 T/m were installed to collimate and focus the beams in the vacuum pipe with an inner diameter of 1.5 cm. As shown in Fig. 2, the detailed positions of the elements and the distances between the quadrupoles were designed in advance using the MAD code[19]. The EMQ field gradients were set to , , , and , with a reference energy of 500 MeV for the beams. For electrons with other energies, the magnetic parameters can be adjusted appropriately to match them. Then, tracking simulations of the beams were performed using the ELEGANT code[20]. A removable Lanex phosphor screen (S2) was placed 10.3 m behind the four EMQs to measure the -beam profile using an intensified charge-coupled device camera. The minimum resolution of the size is estimated as 0.02 mm. The mean rms transverse size of the focused beams with a central energy of was measured to be () [Fig. 2(a)]. Two tunable bending magnets were placed at 3.6 and 16.8 m, respectively, away from the gas-jet targets to deflect the generated beams to analyze the energy spectra before and after manipulation on S1 [Fig. 2(b)] and S3 [Fig. 2(c)], respectively. The energy resolution at 500 MeV is 0.2%.
For the beam focused on S3, the divergence changes after passing through an EMQ; thus, we measure the rms transverse sizes on S2 and S3 in the upright direction, and the divergence on S3 is estimated as . According to Figs. 2(b) and 2(c), the mean rms divergences measured on S1 and S3 are 0.2 and 0.06 mrad, respectively. The minimum resolution of the divergence is estimated as 0.02 mrad. The typical energy spectra of Figs. 2(b) and 2(c) indicate that after modulation by EMQs with tailored focusing fields, the beam is considerably focused and has a much smaller divergence.
To explore the transverse properties of the beams before and after manipulation, we first produced beams measured on S1 with tunable mean peak energies at 250, 340, 380, 470, and 515 MeV by adjusting the accelerating length in Fig. 3. The corresponding energy spreads are 2.1%, 2.6%, 2.4%, 1.8%, and 0.8%, respectively. Complete details of how to adjust the acceleration length to generate tunable beams are presented in Ref. [11]. The beam patterns under the quadrupole manipulation recorded on S2 are shown in Figs. 4(b)–4(f) with the corresponding five peak energies in Fig. 3. In comparison with the 500 MeV beam profile with an rms size of produced by the free-vacuum drift in Fig. 4(a), the beam profiles with mean energies of 380, 470, and 515 MeV in Figs. 4(d)–4(f) after beam manipulation have much smaller horizontal () rms sizes of , , and and vertical () rms sizes of , , and . The 250 MeV pattern in Fig. 4(b) has a stretched horizontal size considerably larger than that of the free pattern in Fig. 4(a) with sizes of larger than 40 mm (horizontal) and 0.36 mm (vertical), which is attributed to the selective effect of quadrupoles on the electron energy, referring to Fig. 5(c).
Figure 3.Peak energy (blue) and energy spread (red) measured on S1 against accelerating length. The error bars represent the statistical discrepancy in each direction.
Figure 4.Raw beam patterns recorded on S2 with different -beam energies and the corresponding electron spectra on S1. (a) Typical 500 MeV beam pattern without manipulation after 10.3 m free-vacuum drift. (b)–(f) Manipulated beam patterns after 10.3 m with mean peak energies of 250, 340, 380, 470, and 515 MeV, respectively. The EMQ parameters are established for 500 MeV beams.
Figure 5.Tracking simulations of the beam line for experimental beams. (a) Evolution of the horizontal (upper lines) and vertical (lower lines) beam sizes along the longitudinal propagation with the corresponding central energies for beams shown in Figs. 4(b)–4(f). The shading bands represent the energy spreads. The lattices of the quadrupoles are represented by the blue boxes. (b), (c) Simulated transverse divergence and size at the end of the line as a function of electron energy. The colored shading bands denote the beam energy with corresponding spreads in Figs. 4(b)–4(f).
In addition to the experiment, we present corresponding numerical simulations based on the above parameters. The evolution of the transverse beam envelopes along the longitudinal propagation is illustrated in Fig. 5(a) with the corresponding peak energies (lines) and spreads (shading bands) for the beams shown in Figs. 4(b)–4(f). The size of the beam evolves with the force of the quadrupole. The optimized divergence and size also depend largely on the beam energy; the final envelope of beam (250 MeV) in the direction is substantially larger than that in the direction. These results are consistent with the experimental results presented in Fig. 4.
As a function of energy at a distance of 10 m, the simulated transverse divergences in Fig. 5(b) indicate that the smallest divergence in the direction is 0.06 (0.08) mrad at an energy of 515 (296) MeV. The energy range for the smallest beam size in Fig. 5(c) differs from that in Fig. 5(b). By adjusting the strengths of the four quadrupoles, we can match the optimal beam sizes and divergences in both directions. As shown in Fig. 5(c), the sizes of beams with corresponding energies in Figs. 4(b)–4(f) are represented by shading bands in accordance with the experimental results. In addition, it is indicated in Figs. 5(a)–5(c) that the energy spread or fluctuation deteriorates the beam evolution. Therefore, only electrons with a particular energy or small energy spread can be successfully collimated due to the chromaticity of the lenses[14].
Additional transverse properties, such as pointing fluctuations, were also investigated. Figure 6(a) shows 29 consecutive shots of 500 MeV -beam profiles and the respective central positions of their profiles without EMQs. The shot-to-shot pointing fluctuation and the beam divergence result in a considerably larger full width at half-maximum (FWHM) size of (). The summed divergence is approximately . Figure 6(b) shows 24 consecutive shots with focusing lenses. The summed FWHM -beam size is estimated as , which is six times smaller than that obtained without focusing. Figures 6(a) and 6(b) also show the central positions of the focused and unfocused beams for all shots, in which the manipulated beam distribution is more concentrated than that without EMQs. The experimental pointing fluctuation is estimated as 0.54 mrad in a free vacuum, which is then reduced to 0.14 mrad with EMQs. The -beam fluctuation is attributed to the initial laser pointing fluctuation[18] and the betatron oscillation of the beam in the focusing laser-driven wakefield. These results indicate that the shot-to-shot pointing fluctuation can be strongly suppressed when these EMQs are activated in the transport beam line. This condition is similar to the object–image relationship of the geometrical focusing beam system, in which the magnetic lenses can cause considerable deflection of the beam. Therefore, this set of experimental EMQ parameters can reduce the off-axis angle of the propagation.
Figure 6.False color images observed on S2. (a) Sum of 29 consecutive 500 MeV -beam profiles and the central positions of each shot (black circles) in free vacuum. (b) Sum of 24 consecutive 500 MeV beams and the central positions (red circles) with the system of focusing lenses.
In conclusion, we characterized long-distance -beam properties after beam extraction from an LWFA. The transition simulations employed to initialize the beam parameters during transition from the laser-plasma to the vacuum stage were crucial in matching the experimental results and the beamline design. In addition, because of the small energy spread resulting from the cascaded LWFA, the high-quality beams exhibited the anticipated properties. The minimized controlled rms beam divergence at the end of the beamline was measured as around 0.06 mrad. Moreover, by collimating and focusing the beams, the rms shot-to-shot pointing fluctuation was considerably reduced from 0.54 mrad (in free vacuum) to 0.14 mrad. The results reveal that with the improvement of the beam divergence and pointing fluctuation after the manipulation, the beam can be transported for a longer distance of tens of meters maintaining the qualities, which is a step forward for subsequent several-tens-of-meters undulator radiation to achieve high-gain FELs.