- Infrared and Laser Engineering
- Vol. 49, Issue 7, 20201024 (2020)
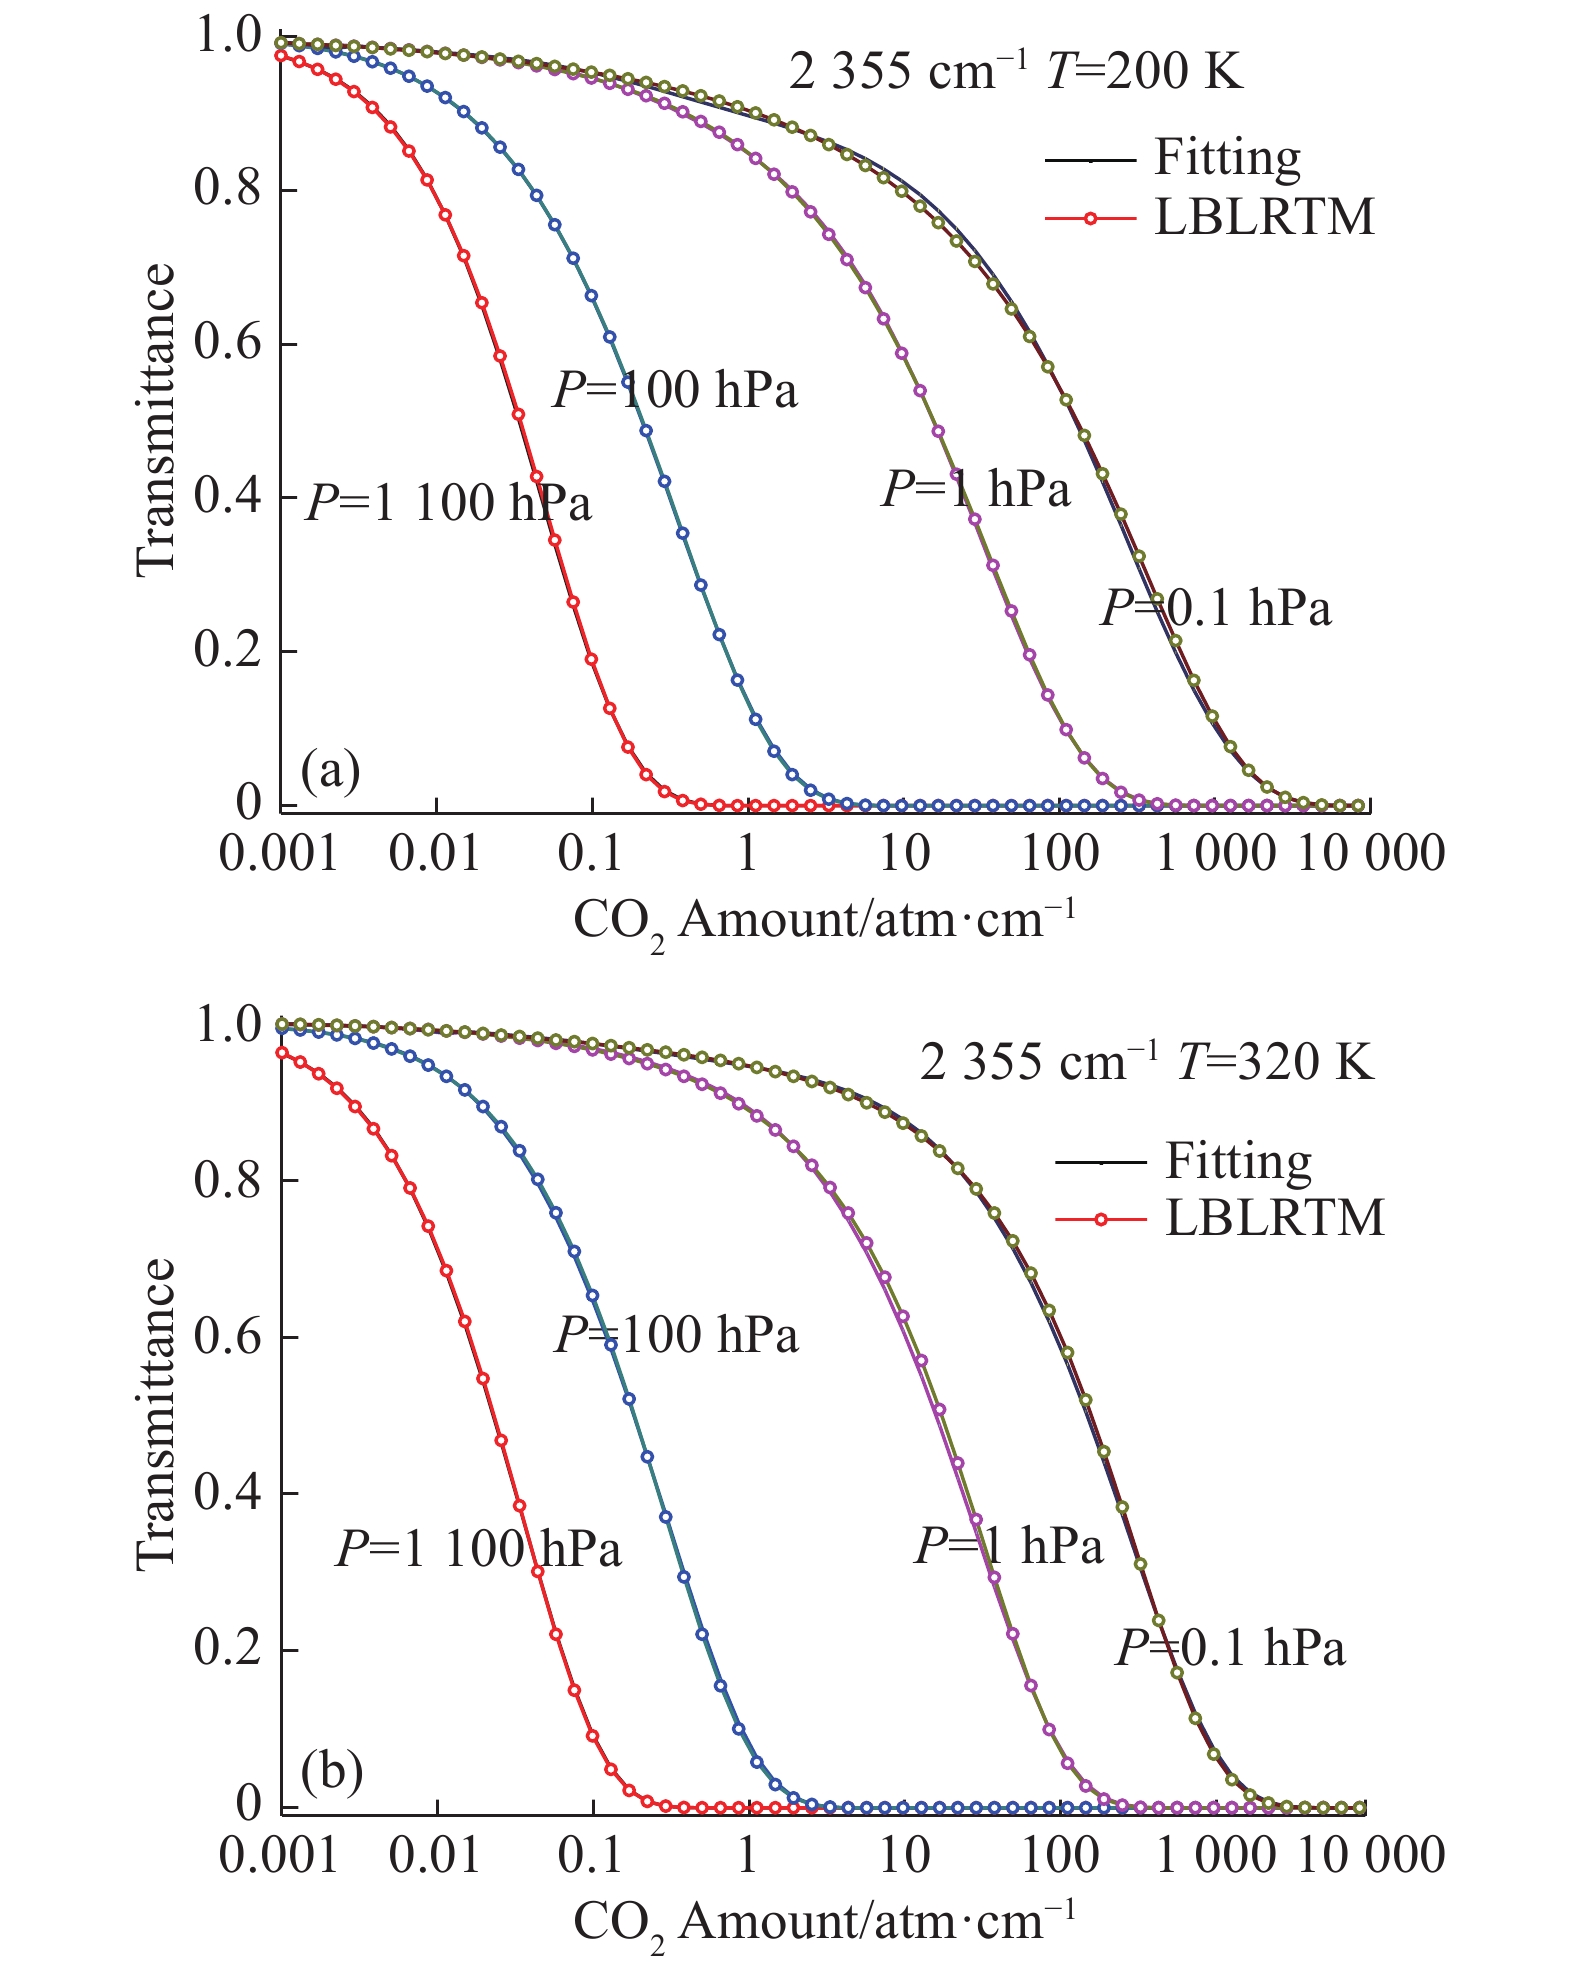
Fig. 1. CO2 transmittance computed with the LBLRTM and fast fitting method vs CO2content at various temperatures, pressures
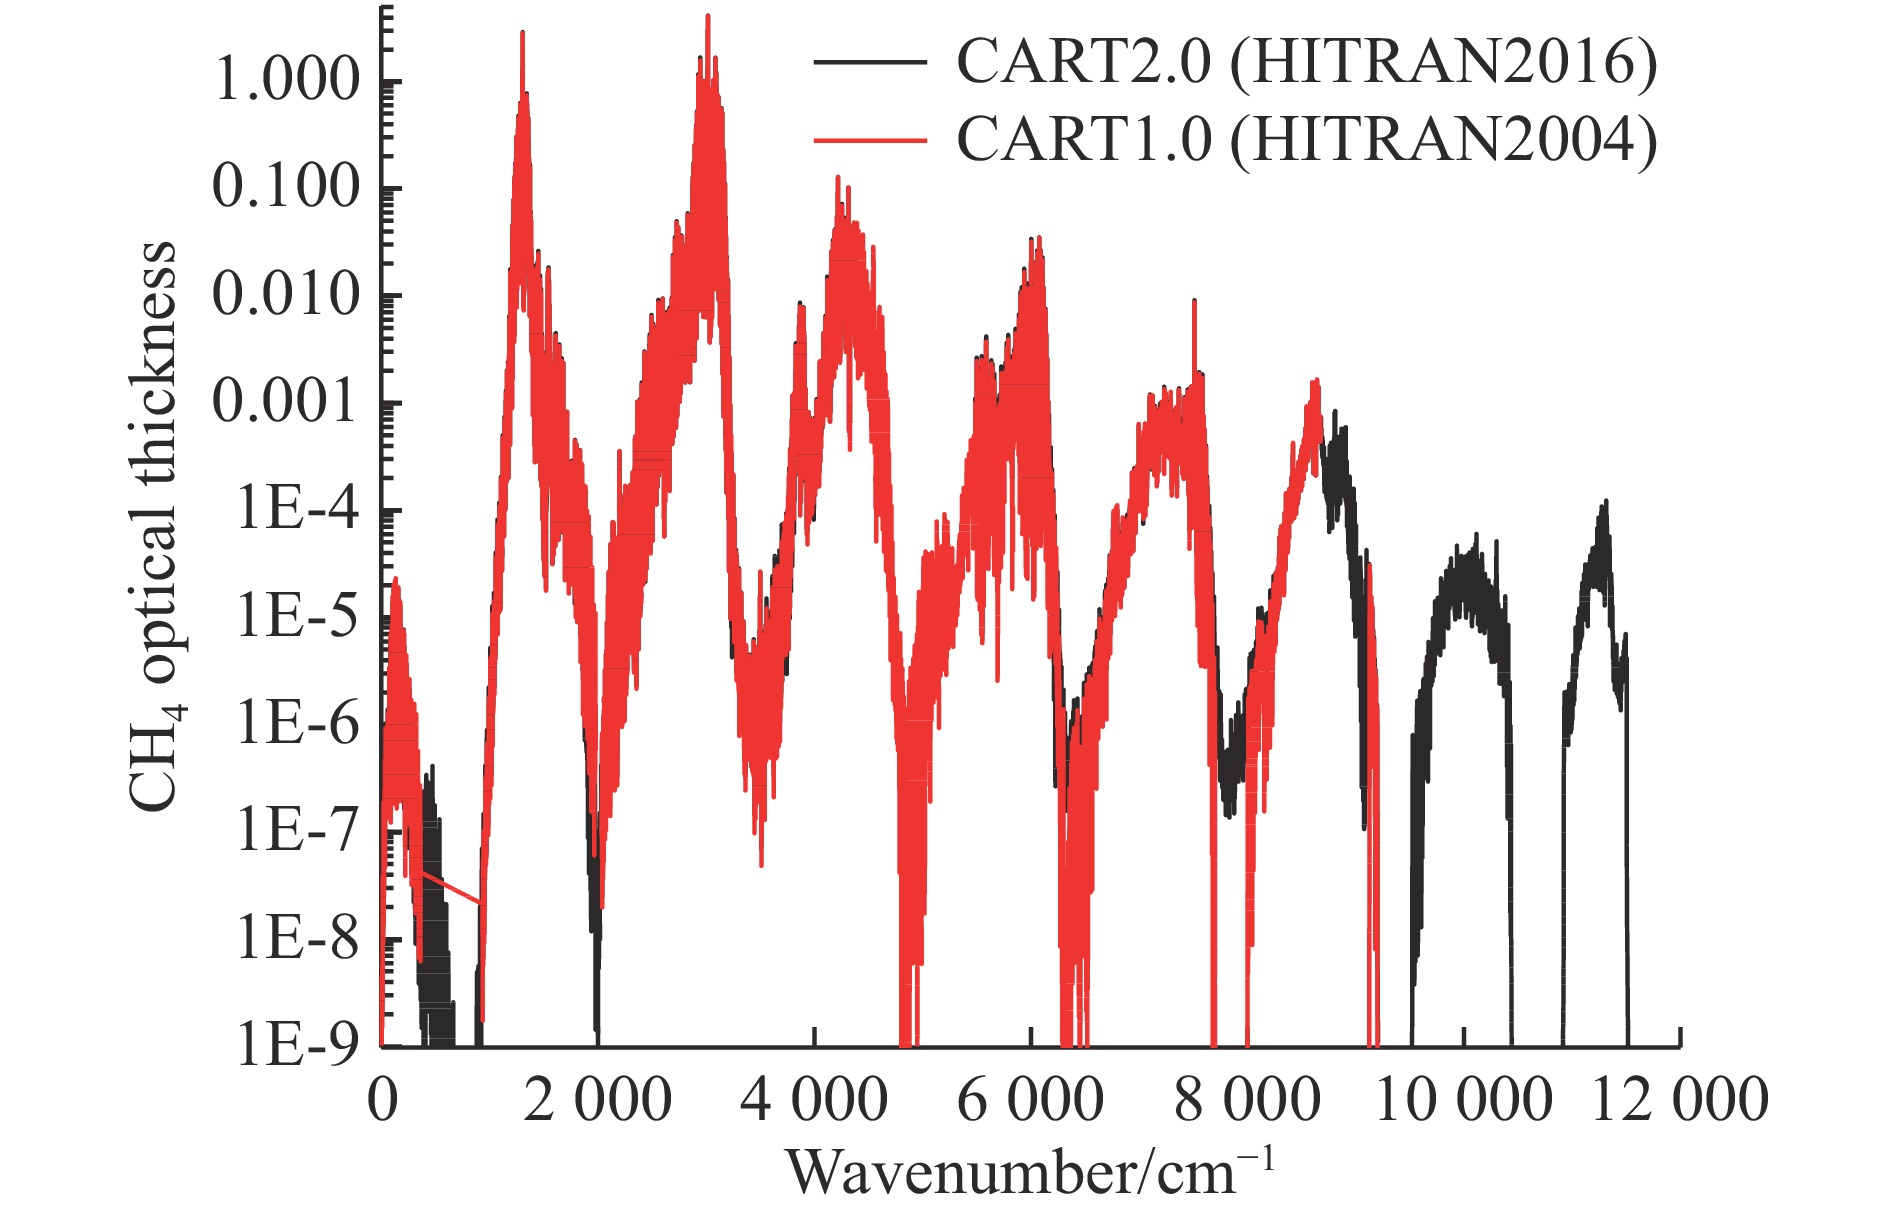
Fig. 2. Horizontal optical depth of CH4 calculated by CART1.0 and CART2.0
Fig. 3. Slant path transmittance of whole atmospheric CH4 calculated by CART1.0 and CART2.0
Fig. 4. Atmospheric transmittance with spectral resolution of 1 cm-1 and 0.1 cm-1 by CART2
Fig. 5. An example of calculated downward atmospheric background spectral radiance (including multiple scattering and thermal radiance) by CART
Fig. 6. Background thermal radiance at the surface(left) and TOA upward(right) by CART2P1
Fig. 7. Solar direct irradiance at the surface and TOA by CART2P1
Fig. 8. Comparisons of calculated transmittance among CART2P1, MODTRAN5 and LBLRTM
Fig. 9. Comparisons of the results between the observed high spectral resolution solar spectra by IFS125HR and calculated transmittance by CART2P1
|
Table 1. Number of absorption lines for 7 main gases in HITRAN database in 2004-2016(0-25 000 cm−1)
|
Table 2. Total strength of absorption lines for 7 main gases in HITRAN database in 2004-2016 (Unit:cm−1/(mole·cm−2))

Download Citation

Set citation alerts for the article
Please enter your email address
© Copyright 2018-2021 | Chinese Laser Press. All Rights Reserved 沪ICP备15018463号-20