• Laser & Optoelectronics Progress
  • Vol. 58, Issue 24, 2410007 (2021)
Mengmeng Ye, Jinbin Hu, Xuejin Wang, and Feng Shao*
Author Affiliations
  • Faculty of Information Science and Engineering, Ningbo University, Ningbo, Zhejiang 315211, China
  • show less
    DOI: 10.3788/LOP202158.2410007 Cite this Article Set citation alerts
    Mengmeng Ye, Jinbin Hu, Xuejin Wang, Feng Shao. No-Reference Stereoscopic Image Quality Assessment Based on Binocular Neuron Response[J]. Laser & Optoelectronics Progress, 2021, 58(24): 2410007 Copy Citation Text show less
    Diagram of binocular energy model
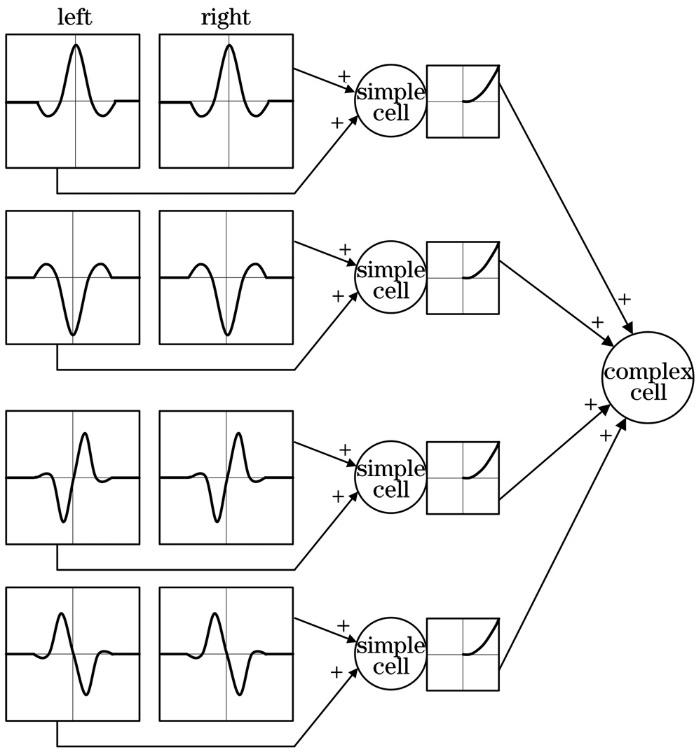
    Fig. 1. Diagram of binocular energy model
    Diagram of stereoscopic image quality assessment model
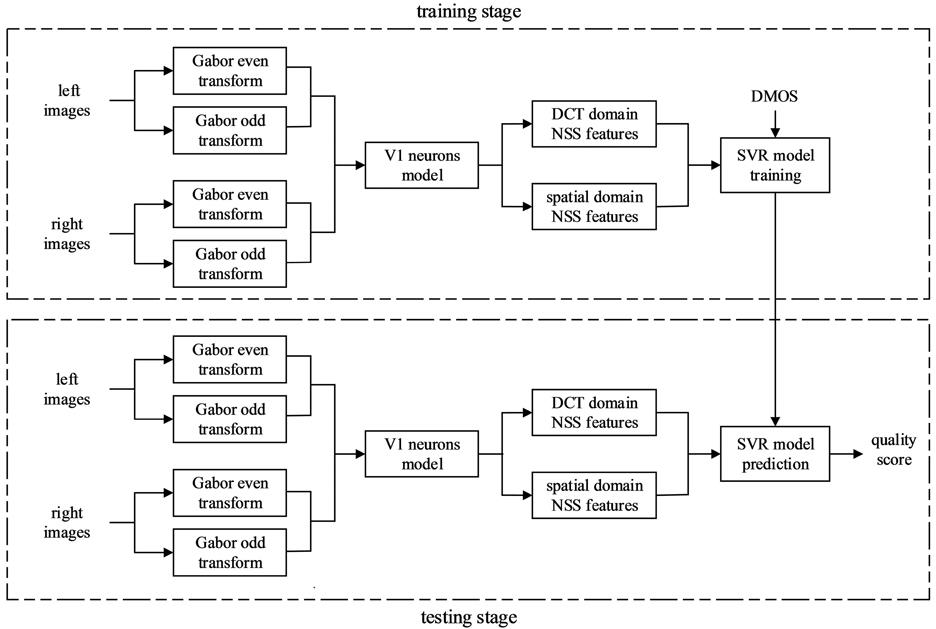
    Fig. 2. Diagram of stereoscopic image quality assessment model
    Five types of V1 neuron response images
    Fig. 3. Five types of V1 neuron response images
    FeatureFeature descriptionSymbolic representation
    DCT domain feature10% and 100% pooled shape parameterf1 and f2
    10% and 100% pooled coefficient of frequency variationf3 and f4
    10% and 100% pooled energy sub-band ratiof5 and f6
    10% and 100% pooled orientation featuref7 and f8
    Spatial feature(α,σ2) from GGD fit of MSCN coefficientsf9 and f10
    (η,υ,σl2,σr2) from AGGD fit of four adjacent MSCN coefficientsf11-f26
    Table 1. Summary of extracted features
    MethodTypeLIVE-ILIVE-II
    PLCCSROCCRMSEPLCCSROCCRMSE
    FI-PSNRFR0.8650.8568.2420.6580.6388.496
    FI-SSIMFR0.8700.8618.0870.6840.6808.230
    Method in Ref.[8]FR0.9250.922-0.7590.745-
    Method in Ref. [9]FR0.8890.8777.5190.7700.7517.204
    Method in Ref. [10]FR0.9180.9096.5010.9070.9014.766
    Method in Ref. [3]NR0.9170.9115.8640.7370.7017.665
    Method in Ref. [4]NR0.9100.9016.7940.7500.7017.198
    Method in Ref. [13]NR0.9220.9036.2580.9130.9054.657
    Method in Ref. [15]NR0.8910.885-0.7840.805-
    Method in Ref. [22]NR0.9380.868-0.8510.831-
    Proposed methodNR0.9380.9275.5830.9370.9313.901
    Table 2. Performance comparison among different assessment metrics on LIVE-I and LIVE-II
    MethodLIVE-ILIVE-II
    JPEGJP2KWNGBFFJPEGJP2KWNGBFF
    FI-PSNR0.2070.8390.9280.9350.6580.6130.7190.9070.7110.701
    FI-SSIM0.2410.8220.9280.8790.6870.5640.7000.9090.7390.735
    Method in Ref. [8]0.6150.8750.9430.9380.7810.7200.8480.8460.8010.851
    Method in Ref. [9]0.3470.8190.9080.9180.6530.8460.8040.9390.8840.874
    Method in Ref. [10]0.4400.8650.9370.9240.7580.8400.8330.9550.9100.889
    Method in Ref. [3]0.6990.8900.8990.9220.6490.5660.7040.4590.8960.711
    Method in Ref. [4]0.5700.8120.9400.8780.7840.6050.6950.4400.8600.683
    Method in Ref. [13]0.6030.8380.9060.7910.6790.8180.8450.9460.9030.899
    Method in Ref. [15]0.693-0.8990.853-0.622-0.8030.713-
    Method in Ref. [22]0.633-0.9200.903-0.788-0.9290.909-
    Proposed method0.7420.8910.9200.8670.7370.8470.8500.9420.9140.903
    Table 3. SROCC results of different assessment metrics on LIVE-I and LIVE-II for different distortion types
    MethodTypeNBU-MDSID INBU-MDSID II
    PLCCSROCCRMSEPLCCSROCCRMSE
    Method in Ref. [8]FR0.9190.9053.6870.8020.8627.212
    Method in Ref. [9]FR0.8560.8344.9430.8200.7807.110
    Method in Ref. [10]FR0.8850.8774.3850.7630.7497.560
    Method in Ref. [3]NR0.9370.9303.2440.8350.8006.589
    Method in Ref. [4]NR0.9200.9003.7010.8240.7996.827
    Method in Ref. [14]NR0.9340.9203.3480.7910.7637.180
    Method in Ref. [15]NR0.8780.8824.5700.6060.6279.586
    Method in Ref. [16]NR0.9160.9223.8360.7850.7657.442
    Method in Ref. [30]NR0.9380.9263.062---
    Method in Ref. [22]NR0.9400.9363.8040.8450.8197.020
    Proposed methodNR0.9630.9523.8870.8590.8516.110
    Table 4. Performance comparison among different assessment metrics on NBU-MDSID I and NBU-MDSID II
    DatabaseIndexNeuron response
    ODF TEODF TIODF ODDRPC TERPC ODDAll
    LIVE-IPLCC0.9440.9420.9440.9430.9460.938
    SROCC0.9340.9250.9330.9360.9380.927
    LIVE-IIPLCC0.8990.9090.9120.9050.9360.937
    SROCC0.8640.8830.8800.8720.9260.931
    NBU-MDSID IPLCC0.9600.9500.9520.9590.9550.963
    SROCC0.9390.9220.9220.9360.9260.952
    NBU-MDSID IIPLCC0.8070.7020.7290.8100.7480.859
    SROCC0.7880.6730.7120.7930.7360.851
    Table 5. Performance comparison among individual response and comprehensive response of five types of neurons
    DatabaseTypeNeuron response
    ODF TEODF TIODF ODDRPC TERPC ODD
    LIVE-IJPEG0.7300.6710.7020.7650.751
    JP2K0.8860.8920.8740.8950.881
    WN0.9010.8850.9080.9020.915
    GB0.8800.8640.8740.8850.884
    FF0.7620.7870.7580.7670.713
    LIVE-IIJPEG0.7190.7810.7220.7160.798
    JP2K0.7620.8190.7440.7680.885
    WN0.9480.9170.9470.9450.943
    GB0.9270.9320.9150.9310.920
    FF0.8610.9160.8800.8570.916
    Table 6. SROCC results of different distortion types under five types of neuron responses
    AlgorithmMethod in Ref.[10]Method in Ref. [3]Method in Ref. [4]Method in Ref. [13]Method in Ref. [22]Proposed method
    Time /s20.79931.2950.542153.3567.7608.703
    Table 7. Running time of each algorithm
    Mengmeng Ye, Jinbin Hu, Xuejin Wang, Feng Shao. No-Reference Stereoscopic Image Quality Assessment Based on Binocular Neuron Response[J]. Laser & Optoelectronics Progress, 2021, 58(24): 2410007
    Download Citation