Author Affiliations
1School of Mechanical Engineering, Jiangnan University, Wuxi, Jiangsu 214122, China2Jiangsu Key Laboratory of Advanced Food Manufacturing Equipment & Technology, Wuxi, Jiangsu 214122, China;3School of Internet of Things Engineering, Jiangnan University, Wuxi, Jiangsu 214122, Chinashow less
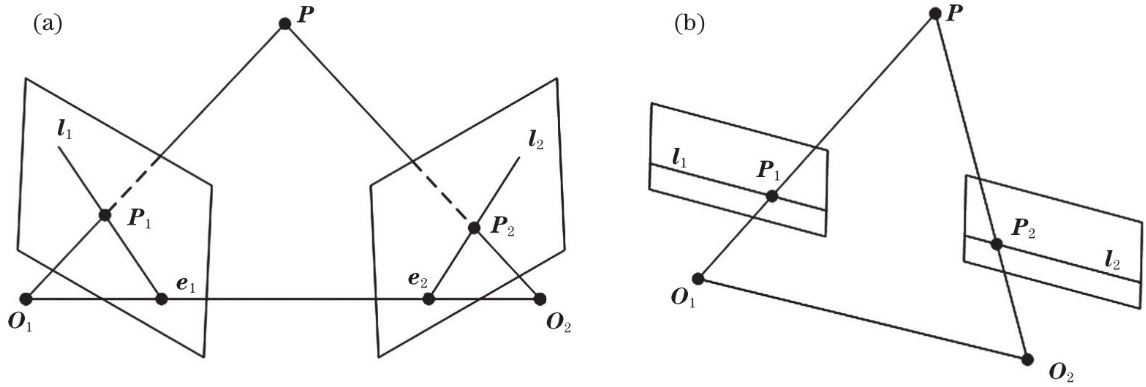
Fig. 1. Structure of the epipolar constraint. (a) Convergent structure; (b) parallel structure
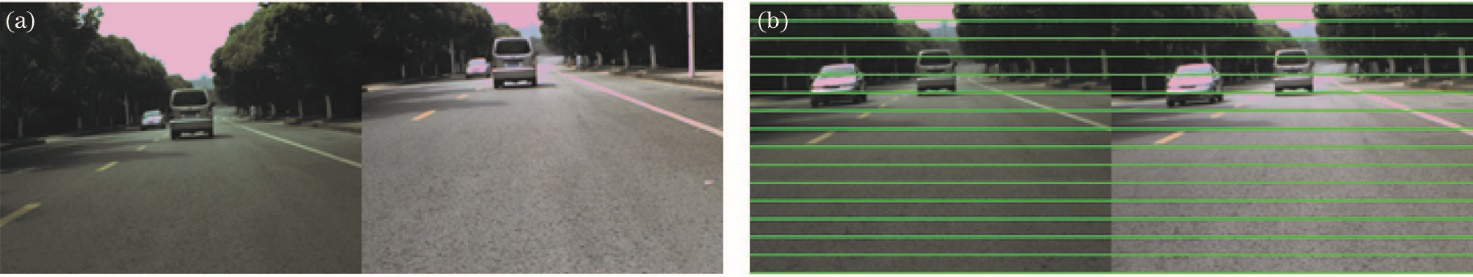
Fig. 2. Results of the epipolar correction. (a) Original image; (b) corrected image
Fig. 3. Structure of k-dimensional tree
Fig. 4. Flow chart of the improve RANSAC method
Fig. 5. Feature matching results of different methods. (a) ORB; (b) ORB-RANSAC; (c) our method
| Parameter | Left camera | Right camera |
|---|
| Internal parameter | | | | Distortion | | | | Rotation matrix | | | Translation matrix | |
|
Table 1. Binocular calibration results
| Image | Original number | After epipolar constraint | After order constraint | After RANSAC |
|---|
| Vehicle | 232 | 217 | 189 | 169 | | Human | 193 | 181 | 145 | 126 |
|
Table 2. Screening results of matching points in each step of our method
| Method | Matched pair | Correct match | Correct rate /% | Time /ms |
|---|
| ORB | 232 | 185 | 79.7 | 70.2 | | ORB-RANSAC | 189 | 184 | 97.3 | 77.8 | | Ours | 169 | 167 | 98.8 | 76.3 |
|
Table 3. Matching results of different methods on vehicle obstacle images
| Method | Matched pair | Correct match | Correct rate /% | Time /ms |
|---|
| ORB | 193 | 159 | 82.4 | 69.6 | | ORB-RANSAC | 140 | 137 | 97.8 | 72.2 | | Ours | 126 | 124 | 98.4 | 71.2 |
|
Table 4. Matching results of different methods on passerby obstacle images
| Number | Left image coordinate | Right image coordinate | Actual coordinates /m |
|---|
| 1 | (296.507, 321.013) | (296.285, 300.480) | (2.2855, 1.9014, -25.3138) | | 2 | (300.761, 261.101) | (300.409, 240.930) | (2.2877, 2.4962, -25.7667) | | 3 | (296.948, 368.129) | (296.460, 347.887) | (2.3194, 1.4921, -25.6768) | | 4 | (216.032, 719.462) | (216.366, 701.969) | (3.5133, -2.0448, -29.7122) | | 5 | (250.254, 641.423) | (250.399, 624.064) | (3.2014,-1.2149, -29.9411) | | 6 | (320.500, 732.100) | (315.594, 714.438) | (2.4056, -2.1744, 29.5954) |
|
Table 5. Sub-pixel coordinate experiment
| Ref. [17] | Actual distance /m | Measuring distance /m | Error /m | Relative error /% | Time /s |
|---|
| 1 | 5 | 4.808 | 0.192 | 3.84 | 0.10825 | | 2 | 10 | 9.689 | 0.311 | 3.11 | 0.11358 | | 3 | 15 | 16.085 | 1.015 | 6.76 | 0.10433 | | 4 | 20 | 21.226 | 1.226 | 6.13 | 0.10957 | | Average | - | - | 0.686 | 4.96 | 0.10893 |
|
Table 6. Ranging results of Ref. [17]
| Ref. [18] | Actual distance /m | Measuring distance /m | Error /m | Relative error/% | Time /s |
|---|
| 1 | 5 | 4.786 | 0.214 | 4.28 | 0.08125 | | 2 | 10 | 9.568 | 0.432 | 4.32 | 0.08756 | | 3 | 15 | 16.124 | 1.124 | 7.49 | 0.07812 | | 4 | 20 | 21.626 | 1.626 | 8.13 | 0.07628 | | Average | - | - | 0.849 | 6.06 | 0.08080 |
|
Table 7. Ranging results of Ref. [18]
| Ours | Actual distance /m | Measuring distance /m | Error /m | Relative error /% | Time /s |
|---|
| 1 | 5 | 4.874 | 0.126 | 2.52 | 0.09097 | | 2 | 10 | 9.781 | 0.219 | 2.19 | 0.09228 | | 3 | 15 | 15.659 | 0.659 | 4.39 | 0.08814 | | 4 | 20 | 20.998 | 0.998 | 4.99 | 0.08557 | | Average | - | - | 0.5005 | 3.52 | 0.08924 |
|
Table 8. Ranging results of our method