• Photonics Research
  • Vol. 10, Issue 8, 1859 (2022)
Runlin Miao1、2、3, Chenxi Zhang1、2、3, Xin Zheng4, Xiang’ai Cheng1、2、3, Ke Yin1、5、6、*, and Tian Jiang1、5、7、*
Author Affiliations
  • 1College of Advanced Interdisciplinary Studies, National University of Defense Technology, Changsha 410073, China
  • 2State Key Laboratory of Pulsed Power Laser Technology, Changsha 410073, China
  • 3Hunan Provincial Key Laboratory of High Energy Laser Technology, Changsha 410073, China
  • 4Defense Innovation Institute, Academy of Military Sciences PLA China, Beijing 100071, China
  • 5Beijing Institute for Advanced Study, National University of Defense Technology, Beijing 100000, China
  • 6e-mail: cqyinke@126.com
  • 7e-mail: tjiang@nudt.edu.cn
  • show less
    DOI: 10.1364/PRJ.458472 Cite this Article Set citation alerts
    Runlin Miao, Chenxi Zhang, Xin Zheng, Xiang’ai Cheng, Ke Yin, Tian Jiang. Repetition rate locked single-soliton microcomb generation via rapid frequency sweep and sideband thermal compensation[J]. Photonics Research, 2022, 10(8): 1859 Copy Citation Text show less
    Experimental setup and 100 GHz soliton microcomb generation. (a) Schematic of the experimental setup. AWG, arbitrary waveform generator; SC-SSBM, suppressed-carrier single-sideband modulator; VCO, voltage-controlled oscillator; PM, phase modulator; DDS, direct digital synthesis; OSA, optical spectrum analyzer; FBG, fiber Bragg grating; OSC, oscilloscope; BPF, band-pass filter; SG, signal generator; Rb clock, rubidium clock. (b) Theory illustration of the pump sideband thermal compensation effect. (c) Observed soliton steps versus scan time in the OSC. The blue curve shows a driving voltage control signal in the AWG, and the red curve shows a microcomb power trace excluding the pump. (d) Optical spectrum of the generated single-soliton state microcomb. A fitted sech2 envelope is indicated by the red line. Two arrows represent the pump laser wavelength and the fitted envelope center, respectively.
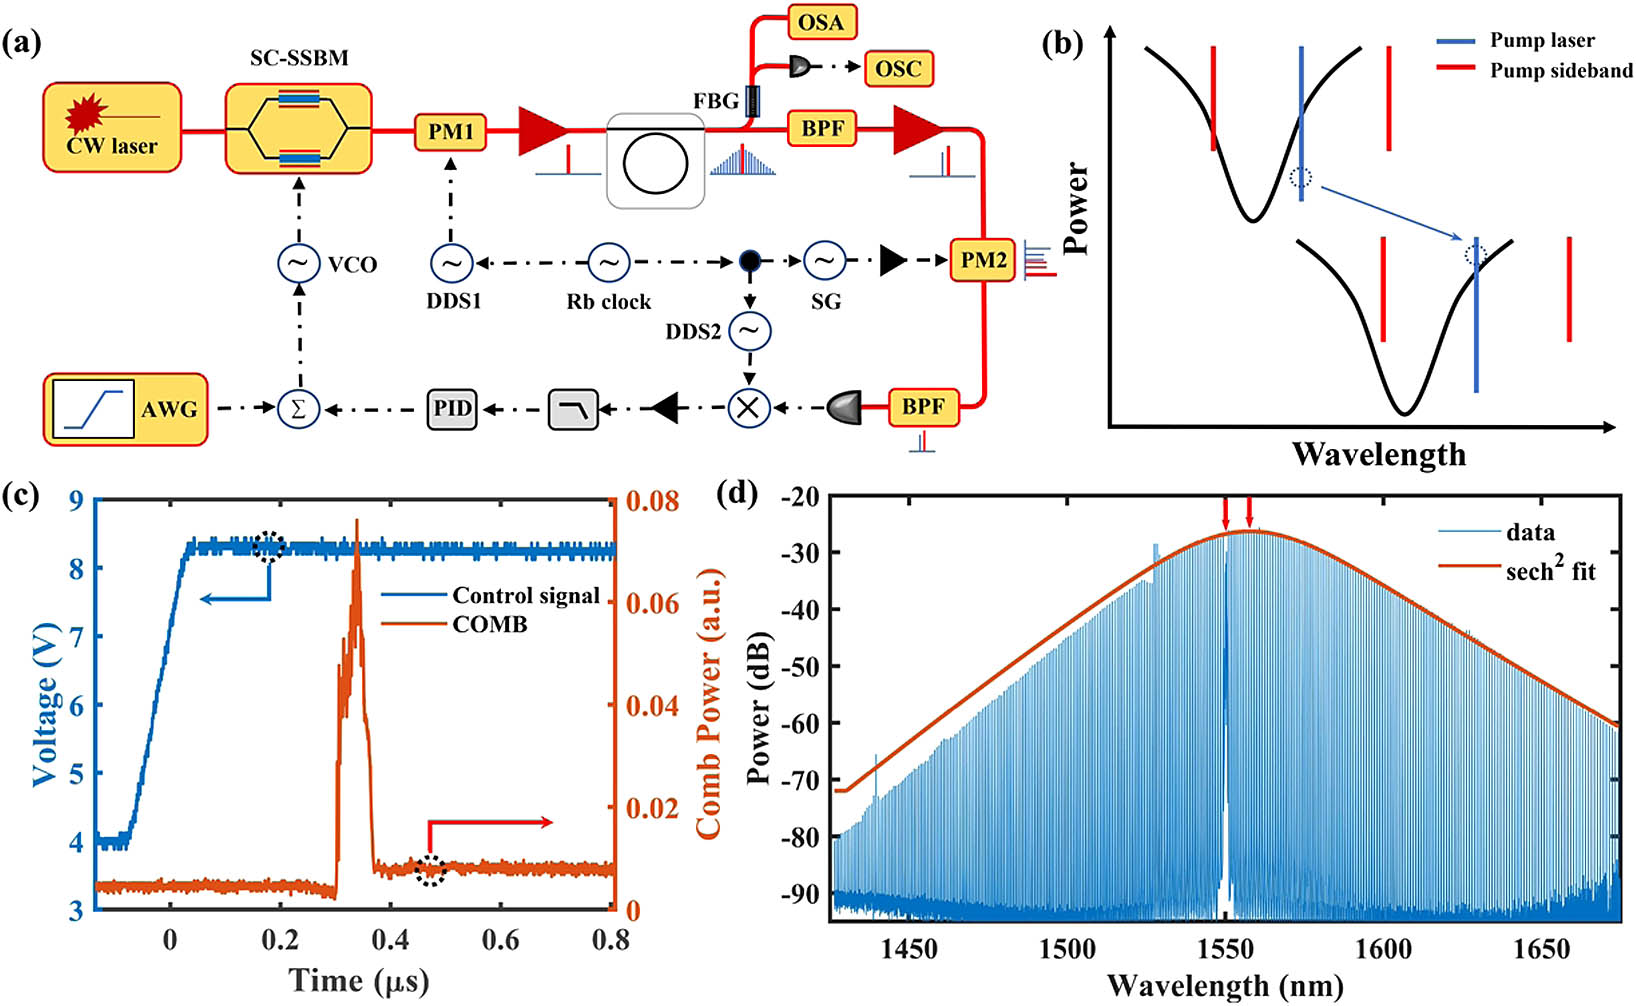
    Fig. 1. Experimental setup and 100 GHz soliton microcomb generation. (a) Schematic of the experimental setup. AWG, arbitrary waveform generator; SC-SSBM, suppressed-carrier single-sideband modulator; VCO, voltage-controlled oscillator; PM, phase modulator; DDS, direct digital synthesis; OSA, optical spectrum analyzer; FBG, fiber Bragg grating; OSC, oscilloscope; BPF, band-pass filter; SG, signal generator; Rb clock, rubidium clock. (b) Theory illustration of the pump sideband thermal compensation effect. (c) Observed soliton steps versus scan time in the OSC. The blue curve shows a driving voltage control signal in the AWG, and the red curve shows a microcomb power trace excluding the pump. (d) Optical spectrum of the generated single-soliton state microcomb. A fitted sech2 envelope is indicated by the red line. Two arrows represent the pump laser wavelength and the fitted envelope center, respectively.
    (a) The EO frequency combs optical spectra of the selected two soliton microcomb lines. (b) Soliton existence area and soliton repetition rate variation with different RF modulation strengths. The arrow direction represents an increase in RF modulation intensity, and the red lines represent linear fit results. (c) Transmission spectrum of the cavity resonant mode with different laser sideband powers. (d) Dependence of the cavity resonance frequency redshift peak on the on-chip optical sideband power and a linear fit.
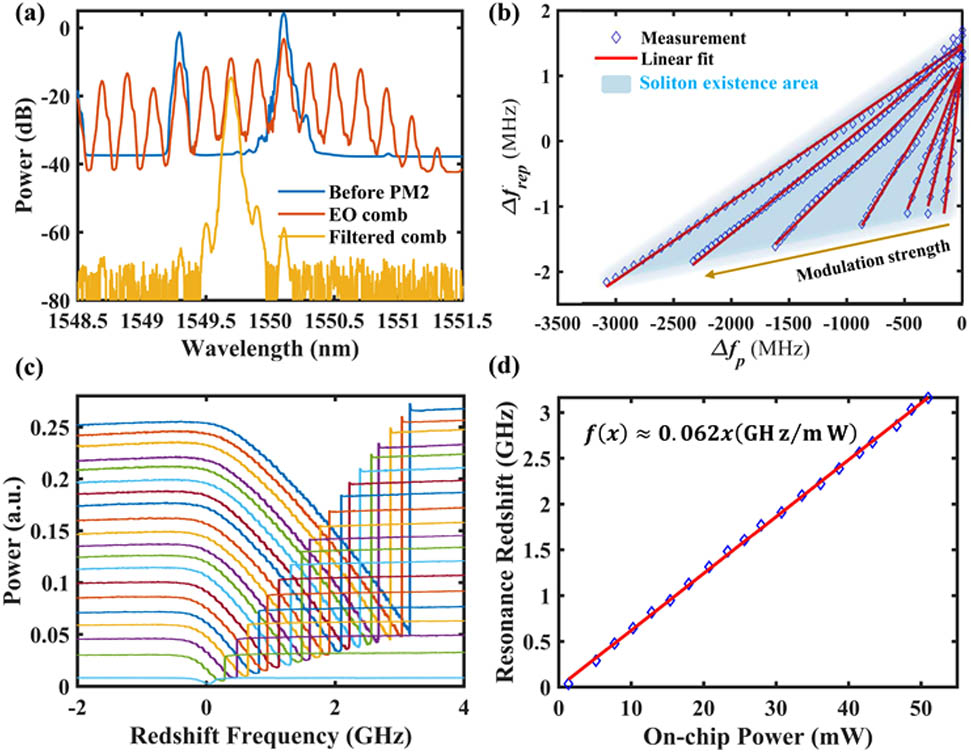
    Fig. 2. (a) The EO frequency combs optical spectra of the selected two soliton microcomb lines. (b) Soliton existence area and soliton repetition rate variation with different RF modulation strengths. The arrow direction represents an increase in RF modulation intensity, and the red lines represent linear fit results. (c) Transmission spectrum of the cavity resonant mode with different laser sideband powers. (d) Dependence of the cavity resonance frequency redshift peak on the on-chip optical sideband power and a linear fit.
    Locking of the soliton repetition rate. (a) Optical spectrum evolution color map beyond 12 h between 1530 and 1565 nm. The color bar reflects the power amplitude in the unit of decibel-milliwatts (dBm). (b) Free-running repetition rate measurements without (blue, right axis) and with (red, right axis) modulation and locked signal (yellow, left axis) measurement within 3 h. (c) Histogram of the locked repetition rate signal. (d) Allan deviations of the free-running repetition rate signal without modulation (blue line) and with modulation (red line), the in-loop locked repetition rate signal (yellow line), and the used Rb atomic clock (purple line).
    Fig. 3. Locking of the soliton repetition rate. (a) Optical spectrum evolution color map beyond 12 h between 1530 and 1565 nm. The color bar reflects the power amplitude in the unit of decibel-milliwatts (dBm). (b) Free-running repetition rate measurements without (blue, right axis) and with (red, right axis) modulation and locked signal (yellow, left axis) measurement within 3 h. (c) Histogram of the locked repetition rate signal. (d) Allan deviations of the free-running repetition rate signal without modulation (blue line) and with modulation (red line), the in-loop locked repetition rate signal (yellow line), and the used Rb atomic clock (purple line).
    RF spectra of (a) free-running repetition rate without modulation at 1 kHz resolution bandwidth (RBW), (b) free-running repetition rate with modulation at 200 Hz RBW, and (c) locked repetition rate at 1 Hz RBW. (d) Single-sideband (SSB) phase noise spectra of repetition rate in the free-running state without modulation (blue line), with modulation (red line), and locked state (yellow line).
    Fig. 4. RF spectra of (a) free-running repetition rate without modulation at 1 kHz resolution bandwidth (RBW), (b) free-running repetition rate with modulation at 200 Hz RBW, and (c) locked repetition rate at 1 Hz RBW. (d) Single-sideband (SSB) phase noise spectra of repetition rate in the free-running state without modulation (blue line), with modulation (red line), and locked state (yellow line).
    Tuning of the soliton repetition rate. (a) Measured time-repetition rate scan maps of soliton microcombs, with the repetition rate variation of 2.5 MHz. (b) Rapid repetition rate tuning measurement at 1 ms gate time, in which the blue circles represent the control signal from the DDS2 and the yellow circles represent the repetition rate measurement results.
    Fig. 5. Tuning of the soliton repetition rate. (a) Measured time-repetition rate scan maps of soliton microcombs, with the repetition rate variation of 2.5 MHz. (b) Rapid repetition rate tuning measurement at 1 ms gate time, in which the blue circles represent the control signal from the DDS2 and the yellow circles represent the repetition rate measurement results.
    Frequency noise and linewidth measurements. (a) Experimental setup of the test scheme. PC, polarization controller; AOM, acousto-optic modulator; PD, photodetector; SSA, signal source analyzer. (b) and (c) Measured frequency noise spectra from 100 Hz to 40 MHz of C34 and C54, respectively. The blue, red, and yellow lines are states of free-running without modulation, with modulation, and of locked operation, respectively. β separation line is marked as a purple dotted line. The spikes at 6.3 MHz and its harmonics are from the measurement tool. (d) Calculated linewidth results of soliton microcombs between −20 and 20 mode number compared to the pump mode. The blue, red, and yellow circles are linewidth results of free-running without modulation, with modulation, and of locked state, respectively.
    Fig. 6. Frequency noise and linewidth measurements. (a) Experimental setup of the test scheme. PC, polarization controller; AOM, acousto-optic modulator; PD, photodetector; SSA, signal source analyzer. (b) and (c) Measured frequency noise spectra from 100 Hz to 40 MHz of C34 and C54, respectively. The blue, red, and yellow lines are states of free-running without modulation, with modulation, and of locked operation, respectively. β separation line is marked as a purple dotted line. The spikes at 6.3 MHz and its harmonics are from the measurement tool. (d) Calculated linewidth results of soliton microcombs between 20 and 20 mode number compared to the pump mode. The blue, red, and yellow circles are linewidth results of free-running without modulation, with modulation, and of locked state, respectively.
    Runlin Miao, Chenxi Zhang, Xin Zheng, Xiang’ai Cheng, Ke Yin, Tian Jiang. Repetition rate locked single-soliton microcomb generation via rapid frequency sweep and sideband thermal compensation[J]. Photonics Research, 2022, 10(8): 1859
    Download Citation