
Bing Pan, Xuanhao Zhang, Long Wang. Study on Gray Level Residual Field Calculation in Digital Volume Correlation[J]. Acta Optica Sinica, 2024, 44(3): 0310001
- Acta Optica Sinica
- Vol. 44, Issue 3, 0310001 (2024)
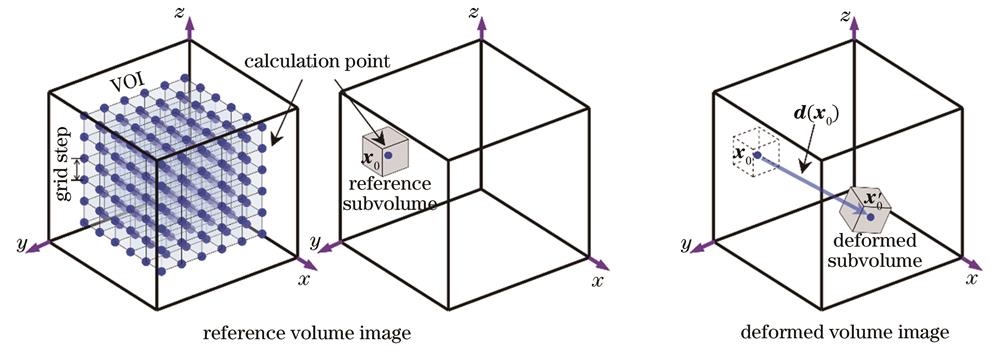
Fig. 1. Bisic principle of DVC

Fig. 2. Schematic diagram of the gray level residual field calculation process
Fig. 3. Schematic diagram of data interpolation based on 3D Delaunay triangulation algorithm
Fig. 4. Schematic illustration of the implementation of tricubic interpolation (k can be -1, 0, 1, 2)
Fig. 5. Simulated volume images of 200 voxel×200 voxel×200 voxel. (a) Reference volume image; (b) deformed volume image; (c) differential image between reference and deformed volume images
Fig. 6. Measurement results by local DVC in simulation experiment. (a) v displacement field; (b) ZNCC coefficient field; (c) von-mises strain field
Fig. 7. Gray level residual fields and grayscale histogram. (a) Uncorrected; (b) corrected; (c) threshold processed; (d) grayscale histogram
Fig. 8. Real test results. (a) Reference volume image; (b) deformed volume image; (c) differential image between the two volume images
Fig. 9. Results obtained by local DVC in real test. (a) ZNCC coefficient field; (b) von-mises strain field; (c) gray level residual field
Fig. 10. Slice maps of different positions of residual gray field and 3D view of the damage location within the nodular graphite cast iron volume image. (a) y=40 voxel slice map; (b) y=85 voxel slice map (the left is the original slice map, and the right is the post-processing slice map); (c) 3D view (the damage region is blue and the nodular graphite is dark)


Set citation alerts for the article
Please enter your email address

© Copyright 2018-2021 | Chinese Laser Press. All Rights Reserved 沪ICP备15018463号-20