• Infrared and Laser Engineering
  • Vol. 49, Issue 6, 20190404 (2020)
Jingjing Liu, Guoying Wang, Zixiang Xu, Yun Liu, Jun Wang, Qing Yan, and Dengxin Hua
Author Affiliations
  • 西安理工大学 机械与精密仪器工程学院,陕西 西安 710048
  • show less
    DOI: 10.3788/IRLA20190404 Cite this Article
    Jingjing Liu, Guoying Wang, Zixiang Xu, Yun Liu, Jun Wang, Qing Yan, Dengxin Hua. Study on calibration method of sky radiometer and aerosol optical properties in Xi''''an region[J]. Infrared and Laser Engineering, 2020, 49(6): 20190404 Copy Citation Text show less
    Distributional characteristics of calibration values of each wavelength and every day
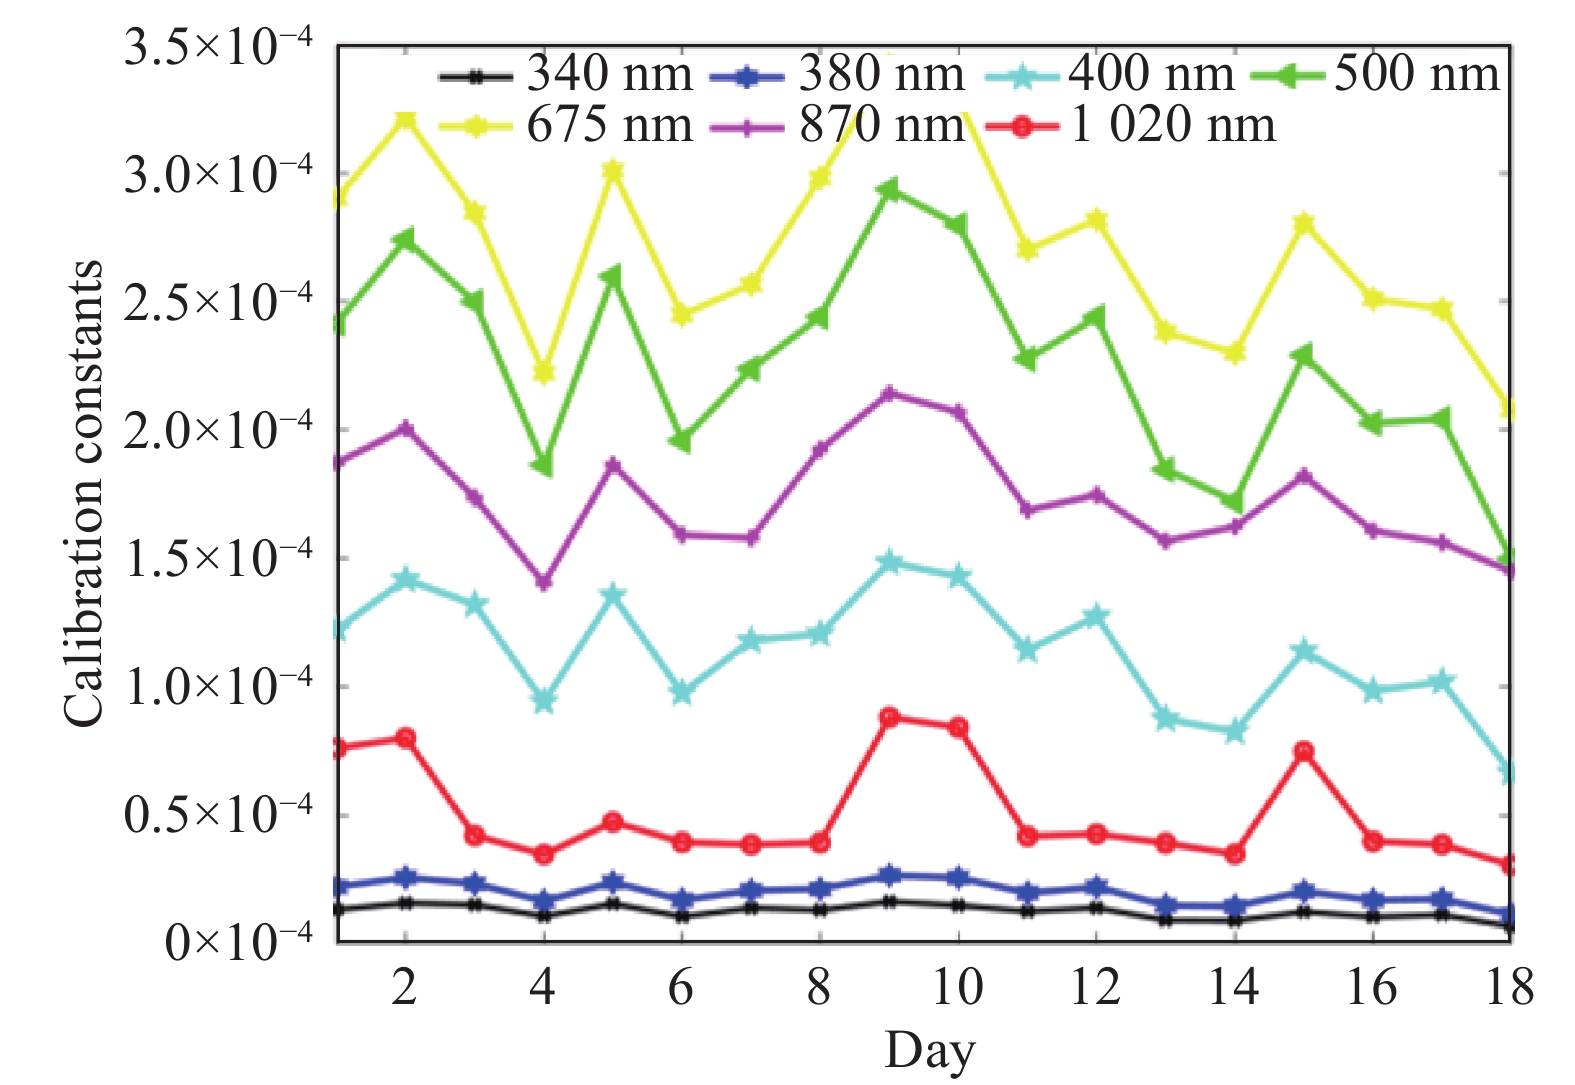
    Fig. 1. Distributional characteristics of calibration values of each wavelength and every day
    Range distribution of calibration values of each wavelength
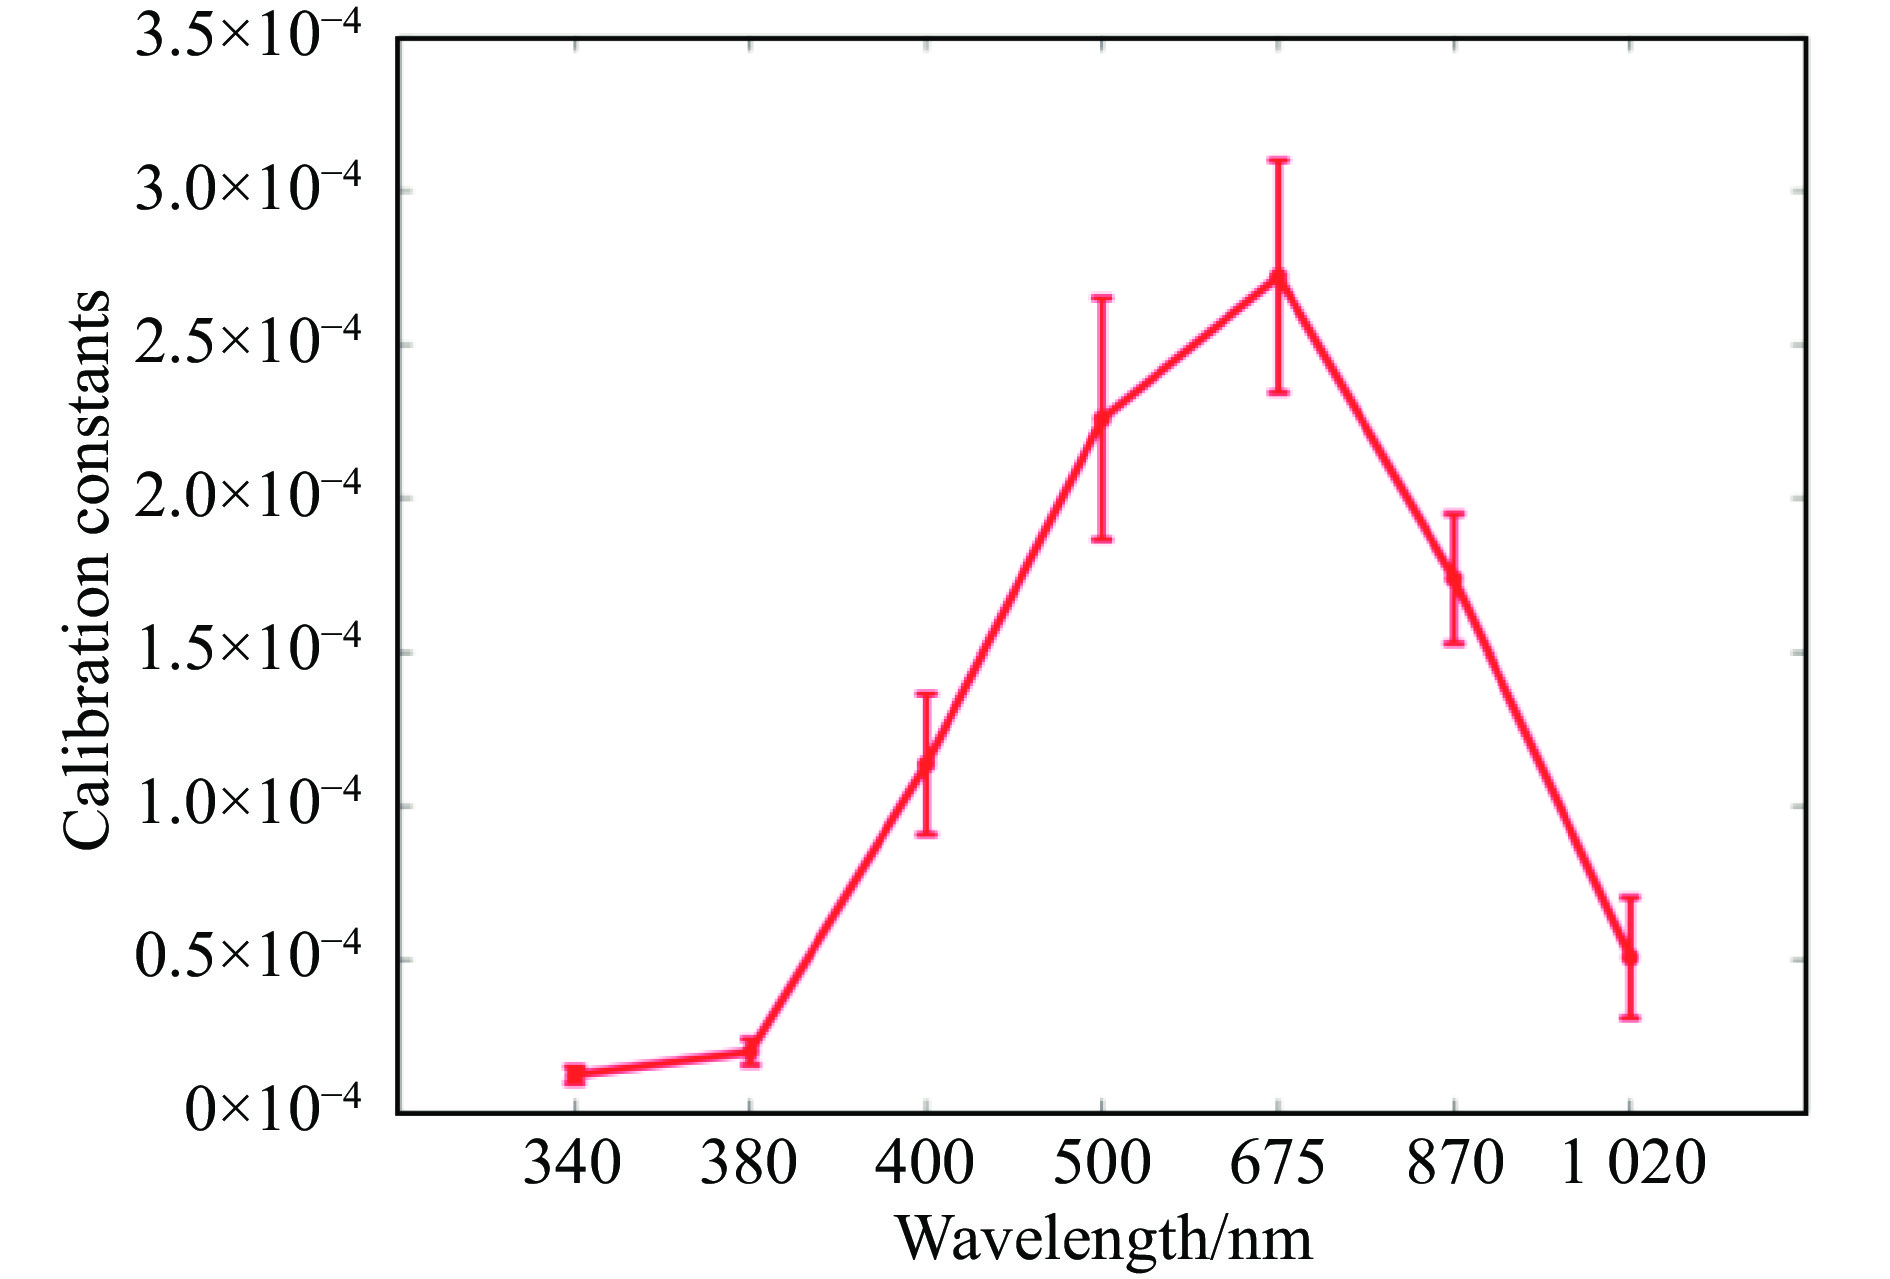
    Fig. 2. Range distribution of calibration values of each wavelength
    Initial and screened result of calibration values in clear day under; (a) 500 nm and (b) 675 nm (The dotted purple and solid cyan lines denote upper-lower limit of the fitting and expectation method, respectively)
    Fig. 3. Initial and screened result of calibration values in clear day under; (a) 500 nm and (b) 675 nm (The dotted purple and solid cyan lines denote upper-lower limit of the fitting and expectation method, respectively)
    Mean value (a) and standard deviation (b) of calibration values of each wavelength before and after data screening
    Fig. 4. Mean value (a) and standard deviation (b) of calibration values of each wavelength before and after data screening
    Diurnal variation types of AOD(500 nm). (a) Flat type, (b) ascending type, (c) descending type, (d) concave type, (e) convex type
    Fig. 5. Diurnal variation types of AOD(500 nm). (a) Flat type, (b) ascending type, (c) descending type, (d) concave type, (e) convex type
    Frequency distribution of diurnal types of AOD
    Fig. 6. Frequency distribution of diurnal types of AOD
    Monthly (a) and seasonal mean values(b) , and frequencies (c) of AOD; Monthly (d) and seasonal mean values(e) , and frequencies (f) of AE
    Fig. 7. Monthly (a) and seasonal mean values(b) , and frequencies (c) of AOD; Monthly (d) and seasonal mean values(e) , and frequencies (f) of AE
    Method340 nm380 nm400 nm500 nm675 nm870 nm1 020 nm
    Fitting method0.016(40.7)0.026(39.5)0.129(43.7)0.195(50.5)0.167(55.9)0.073(65.4)0.026(86.8)
    Expectation method0.008(70.3)0.009(79.1)0.038(83.4)0.092(76.6)0.121(68.1)0.055(73.9)0.026(86.8)
    Table 1. Standard deviation and its improved percentage of calibration values derived from the fitting and expectation method at each wavelength
    Month123456789101112
    Effective days185721254149571838413
    Effective samples2171 3226148399499001 403630448612166
    Table 2. Effective days and samples of every month from POM-02 (Feb. 2015 – Mar. 2018)
    Jingjing Liu, Guoying Wang, Zixiang Xu, Yun Liu, Jun Wang, Qing Yan, Dengxin Hua. Study on calibration method of sky radiometer and aerosol optical properties in Xi''''an region[J]. Infrared and Laser Engineering, 2020, 49(6): 20190404
    Download Citation