• Laser & Optoelectronics Progress
  • Vol. 59, Issue 5, 0530001 (2022)
Arkin Ansardin1、2、3, Sawut Mamat1、2、3、*, and Jinzhao Li1、2、3
Author Affiliations
  • 1College of Resources and Environmental Science, Xinjiang University, Urumqi , Xinjiang 830046, China
  • 2Key Laboratory of Oasis Ecology of Ministry of Education, Urumqi , Xinjiang 830046, China
  • 3Key Laboratory for Wisdom City and Environmental Modeling, Urumqi , Xinjiang 830046, China
  • show less
    DOI: 10.3788/LOP202259.0530001 Cite this Article Set citation alerts
    Arkin Ansardin, Sawut Mamat, Jinzhao Li. Estimation of Chlorophyll Content of Long-Staple Cotton Based on Canopy Spectrum Characteristics[J]. Laser & Optoelectronics Progress, 2022, 59(5): 0530001 Copy Citation Text show less
    Study area diagram and sampling area distribution
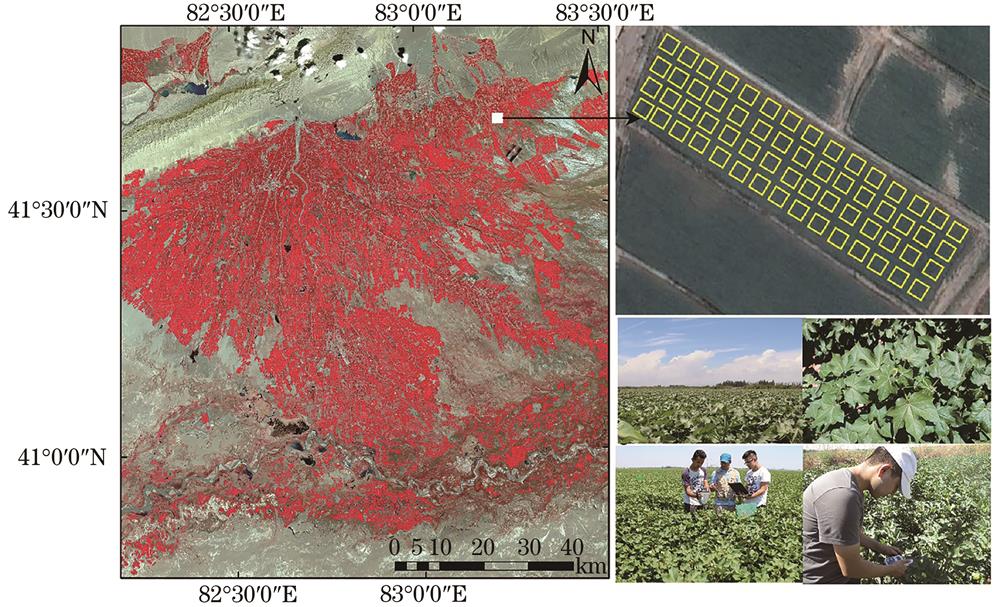
    Fig. 1. Study area diagram and sampling area distribution
    Statistics of chlorophyll content in cotton leaves
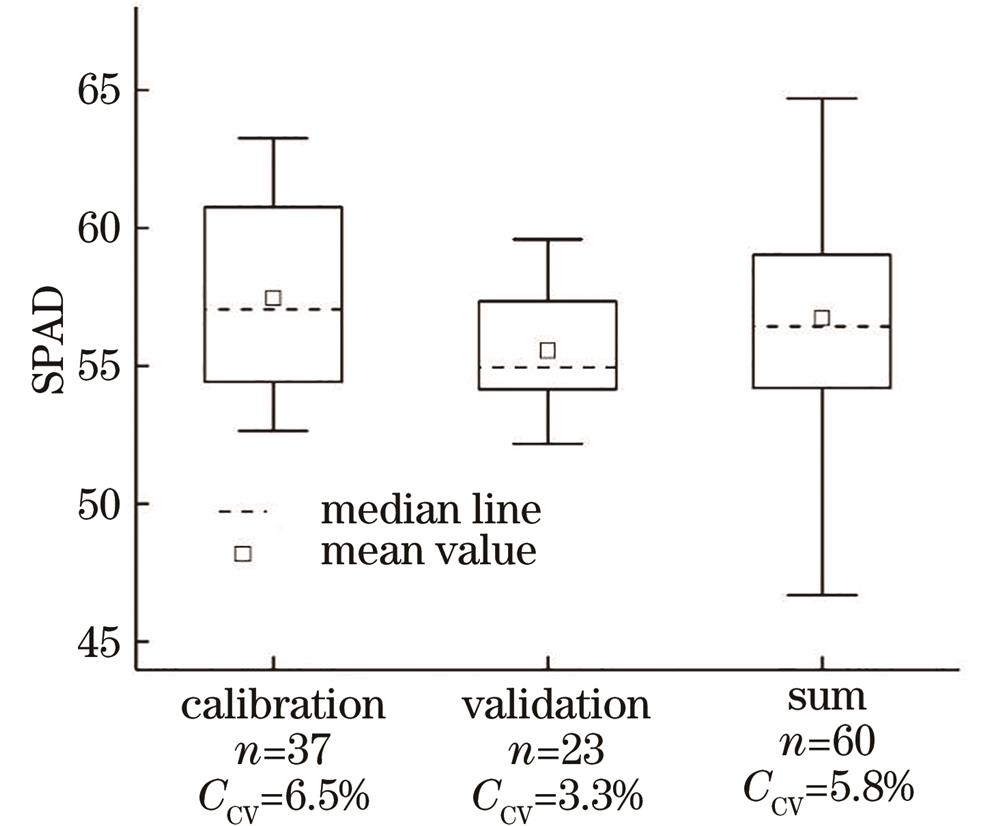
    Fig. 2. Statistics of chlorophyll content in cotton leaves
    Spectral characteristics of cotton leaves. (a) Spectral reflectance of long-staple cotton with different chlorophyll contents; (b) spectral reflectance of different chlorophyll contents in the visible light range
    Fig. 3. Spectral characteristics of cotton leaves. (a) Spectral reflectance of long-staple cotton with different chlorophyll contents; (b) spectral reflectance of different chlorophyll contents in the visible light range
    Changes of spectrum after mathematical transformation. (a) R; (b) R′; (c) Rcr
    Fig. 4. Changes of spectrum after mathematical transformation. (a) R; (b) R′; (c) Rcr
    Correlation between chlorophyll contents and reflectances. (a) R; (b) R′; (c) Rcr
    Fig. 5. Correlation between chlorophyll contents and reflectances. (a) R; (b) R′; (c) Rcr
    Optimized spectral indices. (a) DSI; (b) NDSI; (c) RSI
    Fig. 6. Optimized spectral indices. (a) DSI; (b) NDSI; (c) RSI
    Estimation R2 of SPAD using different SVM kernels. (a) Calibration dataset; (b) validation dataset
    Fig. 7. Estimation R2 of SPAD using different SVM kernels. (a) Calibration dataset; (b) validation dataset
    SVM regression model's fitting analysis result diagrams of measured and predicted values
    Fig. 8. SVM regression model's fitting analysis result diagrams of measured and predicted values
    Index typeFormulaReference
    VISSR=R750/R71029
    NNDVI=(R750- R705)/ R750+R70530
    MMTCI=(R750-R710)/(R710-R68031
    CCARI=[(R700-R670)-0.2×(R700-R550)]32
    OSIRRSIλ1λ2)=Rλ1/Rλ2
    DDSIλ1λ2)=Rλ1-Rλ233
    NNDSIλ1λ2)=(Rλ1-Rλ2)/(Rλ1+Rλ2
    Table 1. Index calculation formulas
    AlgorithmCharacteristic band /nmCorrelation coefficientMean
    R712, 713, 714, 715, 716,‒0.43, 0.43, ‒0.43, ‒0.43, ‒0.43,0.43
    717, 718, 719, 720, 721‒0.43, ‒0.43, ‒0.43, ‒0.43, ‒0.43
    R′513, 524, 527, 572, 589,‒0.53, ‒0.56, ‒0.58, 0.55, 0.53,0.54
    691, 692, 697, 698, 699‒0.53, ‒0.51, ‒0.54, ‒0.54, ‒0.53
    Rcr761, 762, 763, 764, 817,‒0.50, ‒0.49, ‒0.46, ‒0.46, ‒0.47,0.47
    818, 823, 829, 830, 831‒0.47, ‒0.46, ‒0.48, ‒0.47, ‒0.46
    Table 2. Cotton spectral characteristic bands and correlation coefficients
    Vegetation indexRRRcr
    SR0.35**0.41**0.35**
    NDVI0.27*0.46**0.28*
    MTCI0.49**0.46**0.49**
    CARI-0.52**-0.51**-0.42**
    Table 3. Correlation coefficients between vegetation index and chlorophyll content
    Optimized spectral indexBand combinationCorrelation coefficientMean
    RSI942 945, 941 947,950 956, 1028 1051,928 10510.48, 0.43,0.42, 0.39,0.390.422
    DSI716 719, 693 936,565 738, 610 740,636 7410.77, 0.76,0.75, 0.74,0.730.75
    NDSI941 952, 941 947,956 950, 928 1051,1028 10510.46, 0.43,0.42, 0.39,0.380.418
    Table 4. Correlation between chlorophyll contents and optimal spectral indices
    ModelItemCalibrationValidation
    R2RRMSERRER2RRMSERRE
    AlgorithmR0.412.881.260.291.530.43
    R0.721.990.720.840.720.14
    Rcr0.392.911.10.830.690.16
    VIR40.512.611.10.641.110.31
    R40.492.741.180.431.370.39
    Rcr40.382.961.360.501.290.35
    OSIDDSI0.493.021.340.231.60.52
    NNDSI0.452.821.090.581.190.25
    RRSI0.532.620.990.581.180.24
    Table 5. Comparison of modeling results of SVM regression model RBF kernel type
    Arkin Ansardin, Sawut Mamat, Jinzhao Li. Estimation of Chlorophyll Content of Long-Staple Cotton Based on Canopy Spectrum Characteristics[J]. Laser & Optoelectronics Progress, 2022, 59(5): 0530001
    Download Citation