• Acta Optica Sinica
  • Vol. 39, Issue 6, 0601002 (2019)
Mengjiao Ding, Zhongfeng Qiu*, Hailong Zhang, Zhaoxin Li, and Ying Mao
Author Affiliations
  • School of Marine Sciences, Nanjing University of Information Science & Technology, Nanjing, Jiangsu 210044, China
  • show less
    DOI: 10.3788/AOS201939.0601002 Cite this Article Set citation alerts
    Mengjiao Ding, Zhongfeng Qiu, Hailong Zhang, Zhaoxin Li, Ying Mao. Inversion Algorithm for Turbidity of Bohai and Yellow Seas Based on NPP-VIIRS Satellite Data[J]. Acta Optica Sinica, 2019, 39(6): 0601002 Copy Citation Text show less
    Study area, location of buoy, and sampling stations of different cruises
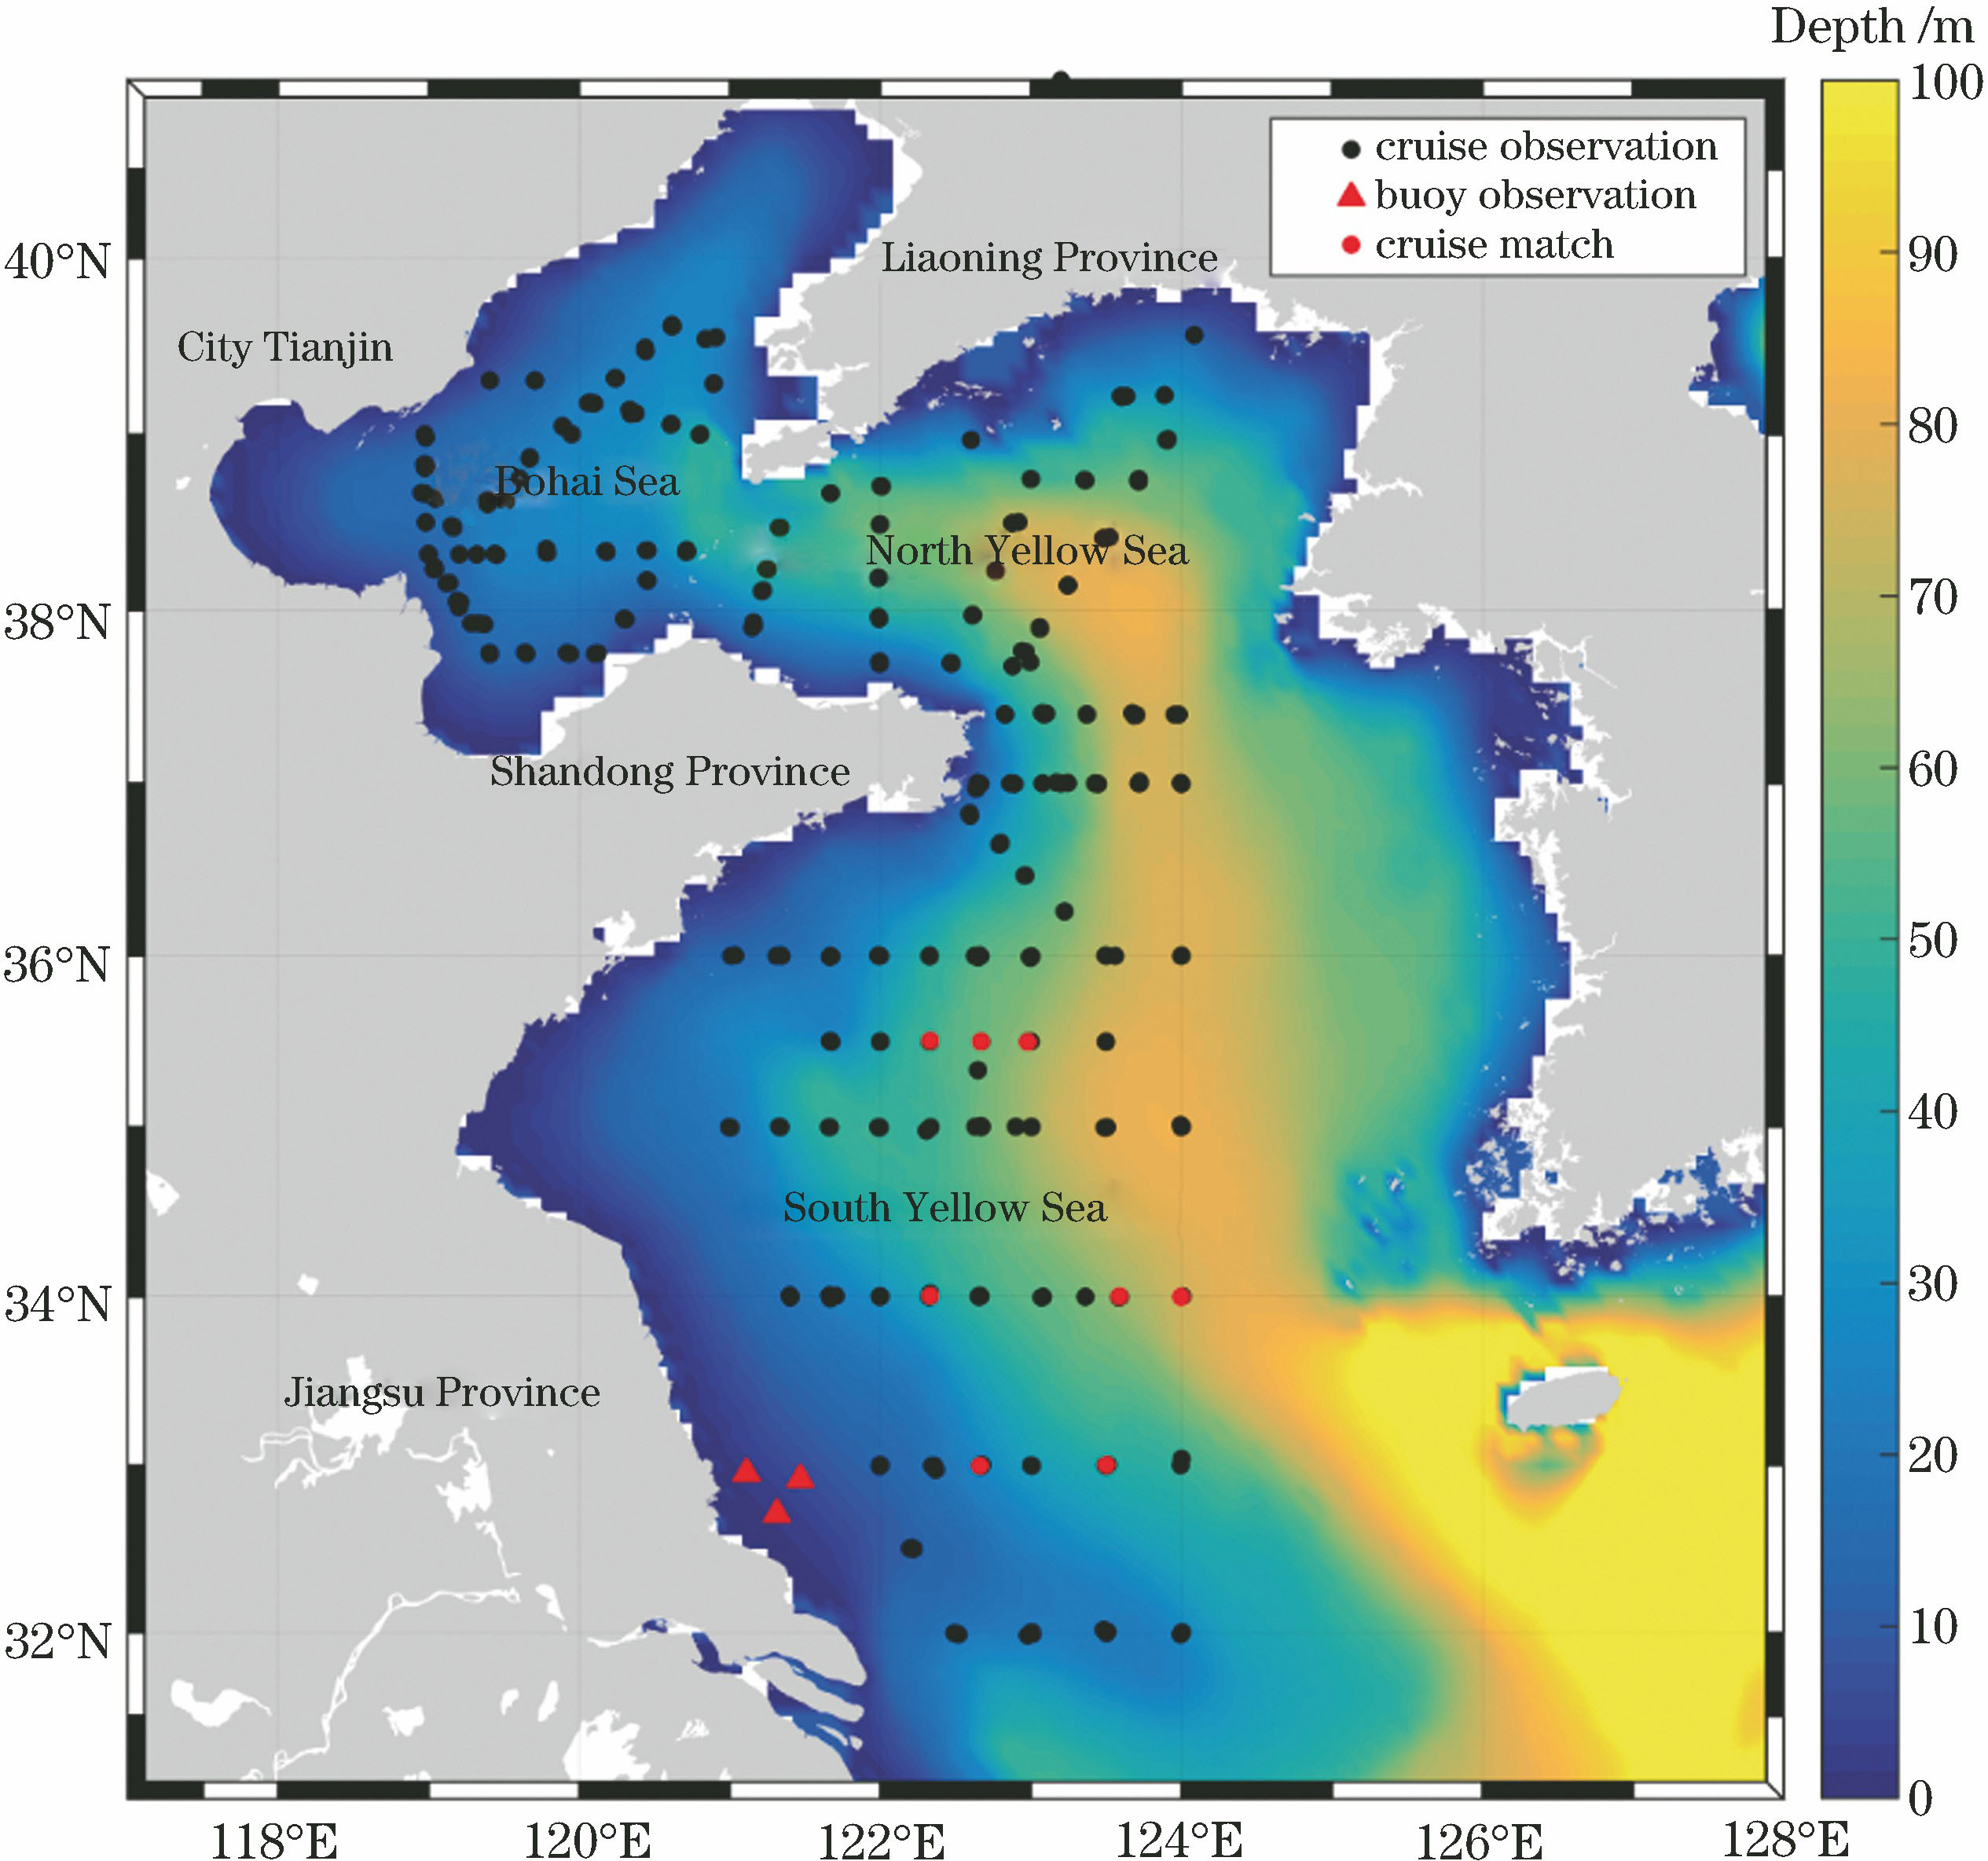
    Fig. 1. Study area, location of buoy, and sampling stations of different cruises
    Turbidity statistics of water bodies based on (a) buoy and (b) cruise observation
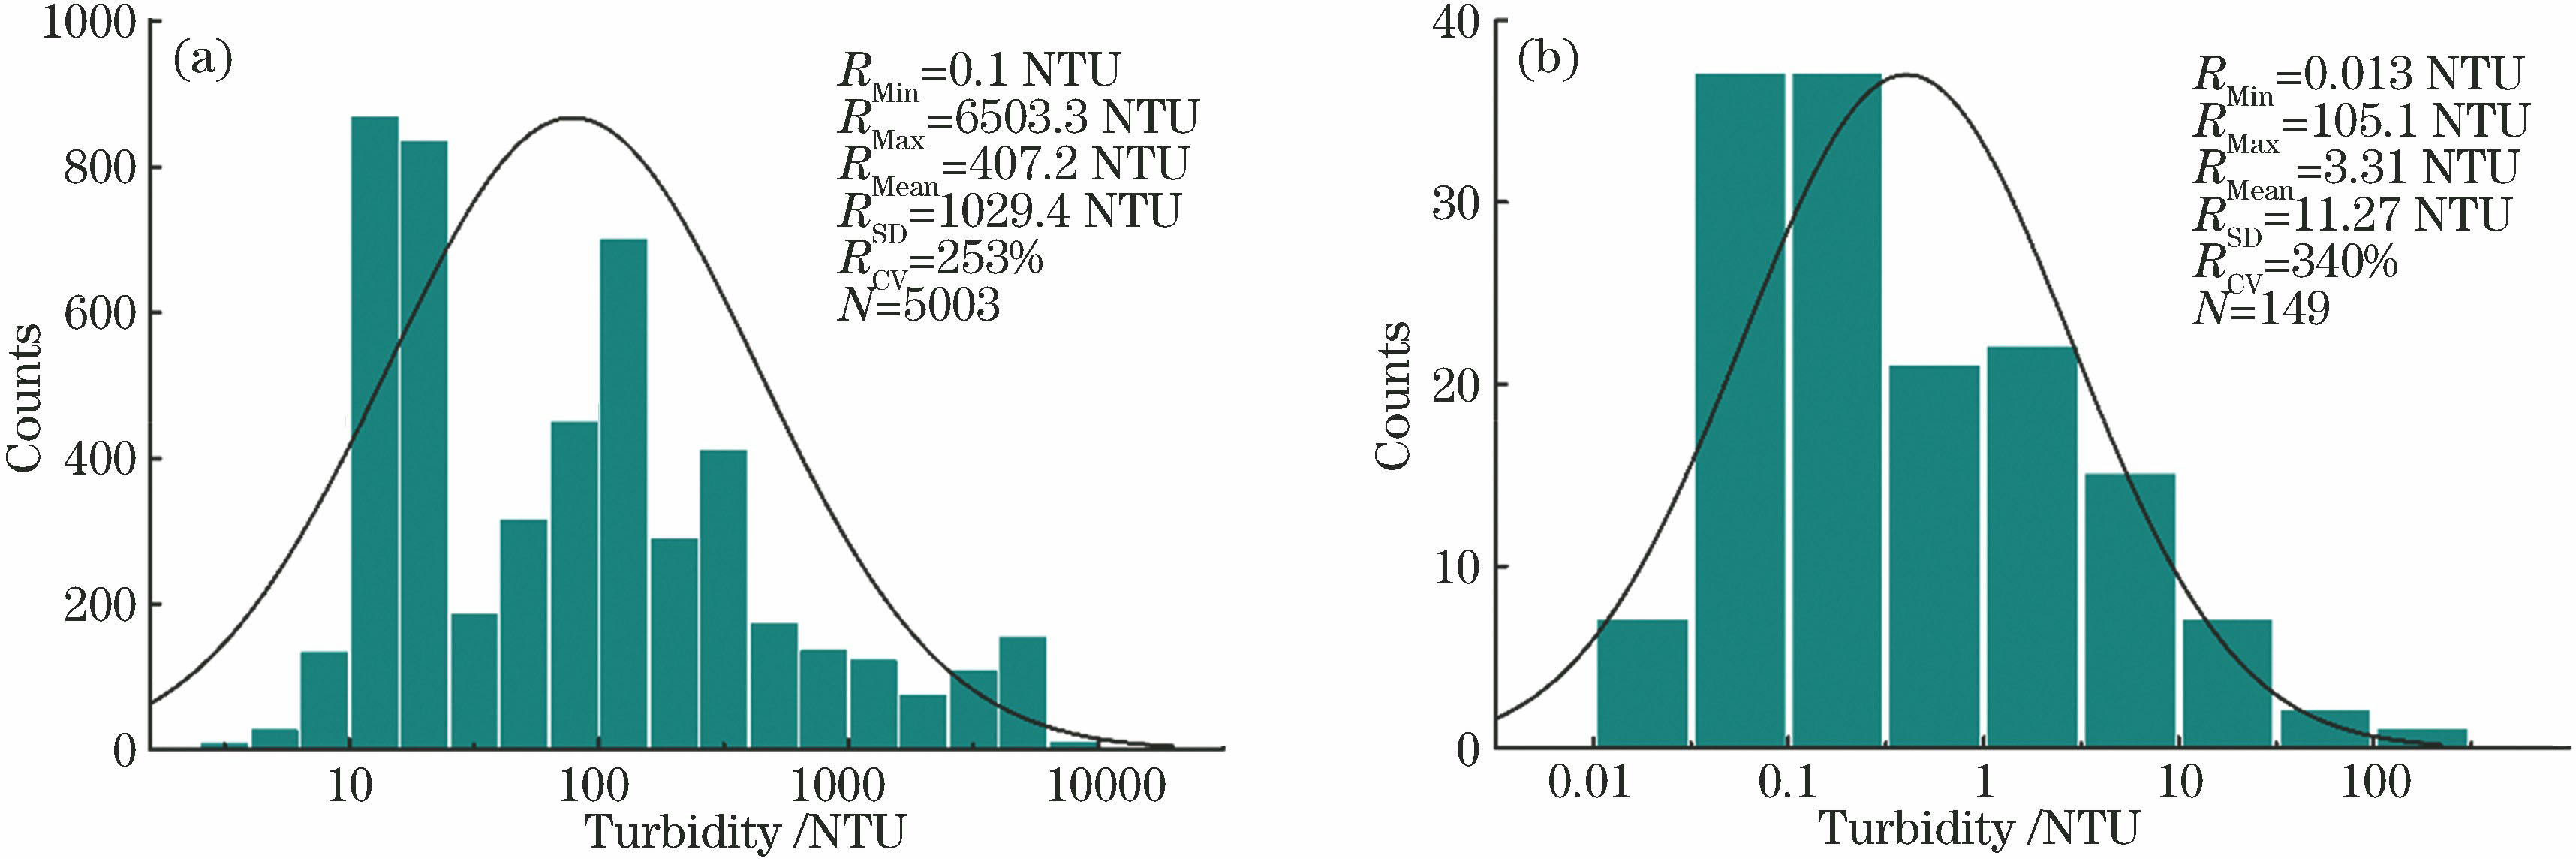
    Fig. 2. Turbidity statistics of water bodies based on (a) buoy and (b) cruise observation
    Correlation coefficient between Rrs under different forms and T versus wavelength
    Fig. 3. Correlation coefficient between Rrs under different forms and T versus wavelength
    Turbidity and result of inversion model developed using X1 (blue dots are matching dataset of measured data and satellite data). (a) Model calibration; (b) model validation
    Fig. 4. Turbidity and result of inversion model developed using X1 (blue dots are matching dataset of measured data and satellite data). (a) Model calibration; (b) model validation
    Turbidity and result of inversion model developed using X2 (blue dots are matching dataset of measured data and satellite data). (a) Model calibration; (b) model validation
    Fig. 5. Turbidity and result of inversion model developed using X2 (blue dots are matching dataset of measured data and satellite data). (a) Model calibration; (b) model validation
    Scatter plots of measured and estimated turbidity obtained by different models after adding ±5% random errors to Rrs at 443 nm and 486 nm (blue dots are matching dataset of measured data and satellite data). (a) X1 model; (b) X2 model
    Fig. 6. Scatter plots of measured and estimated turbidity obtained by different models after adding ±5% random errors to Rrs at 443 nm and 486 nm (blue dots are matching dataset of measured data and satellite data). (a) X1 model; (b) X2 model
    Monthly average distributions of water turbidity in Bohai and Yellow seas (2012—2018)
    Fig. 7. Monthly average distributions of water turbidity in Bohai and Yellow seas (2012—2018)
    Seasonal average distributions of water turbidity in Bohai and Yellow seas (2012—2018)
    Fig. 8. Seasonal average distributions of water turbidity in Bohai and Yellow seas (2012—2018)
    XGeneral formBest band combinationR2
    X1lg Rrs(λ3)λ3=486 nm0.988
    X2lgRrs(λ2)+lgRrs(λ3)lgRrs(λ2)/lgRrs(λ3)λ2=443 nm,λ3=486 nm0.988
    X3lg Rrs(λ4)-lg Rrs(λ5)λ4=551 nm,λ5=671 nm0.902
    X4lg Rrs(λ4)/lg Rrs(λ5)λ4=551 nm,λ5=671 nm0.729
    X5lgRrs(λ3)-lgRrs(λ5)lgRrs(λ3)+lgRrs(λ5)λ3=486 nm,λ5=671 nm0.729
    X6lgRrs(λ4)-lgRrs(λ5)lgRrs(λ4)/lgRrs(λ5)λ4=551 nm,λ5=671 nm0.934
    Table 1. Comparison of correlation coefficients between lg T and lg Rrs under different band combinations
    Independent variableCoefficient of modelNR2SRMSE /NTUSMAE /NTUSMRE /%
    ab
    X1X23.4361.6848.0247.78432320.9740.97116.09.4231734.6337.93
    Table 2. Statistics of coefficients of turbidity inversion model and its accuracy evaluation parameters
    Mengjiao Ding, Zhongfeng Qiu, Hailong Zhang, Zhaoxin Li, Ying Mao. Inversion Algorithm for Turbidity of Bohai and Yellow Seas Based on NPP-VIIRS Satellite Data[J]. Acta Optica Sinica, 2019, 39(6): 0601002
    Download Citation