
Hong Cheng, Li Wang, Rui Wang, Xinyu Xiang, Quanbing Zhang, Xiaotian Zhu. Phase retrieval based on the transport of intensity equation under adaptive focus[J]. Infrared and Laser Engineering, 2022, 51(3): 20210231
- Infrared and Laser Engineering
- Vol. 51, Issue 3, 20210231 (2022)
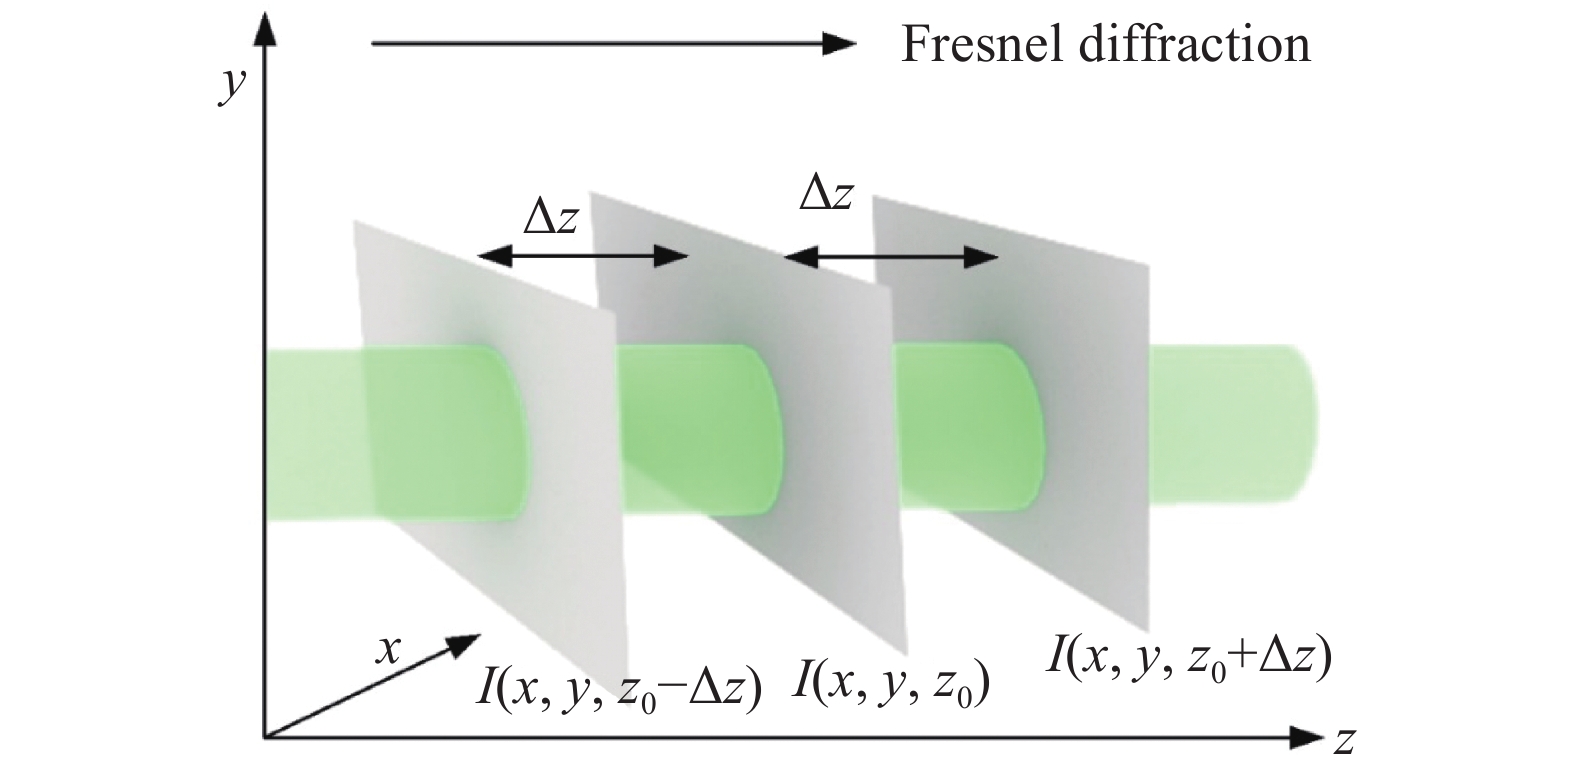
Fig. 1. Schematic diagram of intensity differential estimation
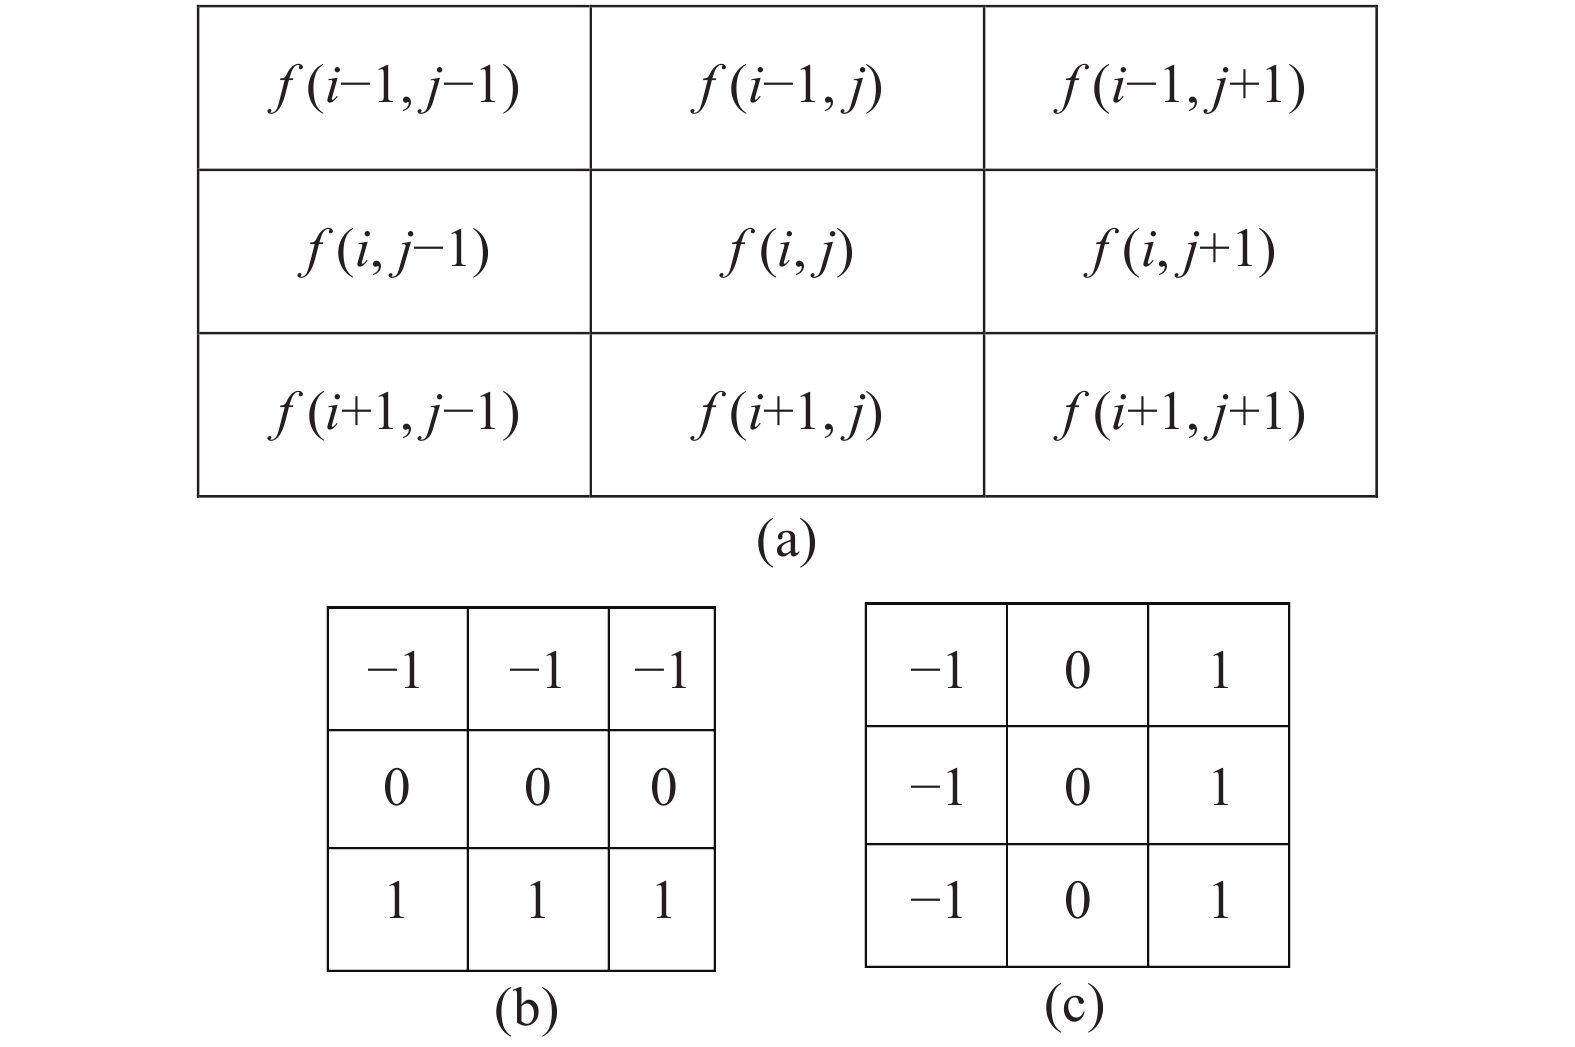
Fig. 2. Edge detect. (a) The gray value of the image's neighborhood pixel at (i ,j ); (b) Prewitt operator level template ; (c) Prewitt operator vertical template
Fig. 3. Algorithm flow chart
Fig. 4. Schematic diagram of edge duty ratio and angular spectrum propagation direction under different conditions
Fig. 5. Simulation experiment. (a) Set intensity image; (b) Set phase image; (c) A series of intensity images (including focus) of angular spectrum propagation; (d) EDR-TIE positioning calculation results and 0 position phase results graph; (e) AF-TIE positioning calculation result graph
Fig. 6. Simulates experiment. (a) Set intensity image; (b) Set phase image; (c) A series of intensity images (unfocused) of angular spectrum propagation; (d) EDR-TIE positioning calculation results; (e) Phase retrieval results of EDR-TIE positioning positions; (f) AF-TIE positioning calculation results and phase retrieval results; (g) A series of intensity image AF-TIE positioning calculation results propagated by the 0 position angular spectrum in Fig.6(f)
Fig. 7. Experimental device diagram and internal optical path
Fig. 8. Real experiment-plant rhizome cross section. (a) EDR-TIE positioning calculation result diagram; (b) EDR-TIE positioning position phase result diagram; (c) Partially enlarged phase result diagram of (b); (d) AF-TIE positioning calculation result diagram; (e) AF-TIE positioning position phase result diagram; (f) Partially enlarged phase result diagram of (e); (g) Optimal focus position angle spectrum AF-TIE positioning calculation result diagram
Fig. 9. Validation of focused results. (a) 7 intensity images taken by the microscope; (b) Positioning result by edge duty ratio
Fig. 10. Actual experience micro lens array: (a) EDR-TIE positioning results; (b) AF-TIE was the best position result; (c) The optimal focus position angular spectrum AF-TIE positioning calculation result; (d) EDR-TIE position phase result and solid line section height curve; (e) AF-TIE position phase results and solid line section height curve
|
Table 1. Evaluation results of different algorithms
|
Table 2. Evaluation of retrieval phase by different algorithms

Set citation alerts for the article
Please enter your email address
© Copyright 2018-2021 | Chinese Laser Press. All Rights Reserved 沪ICP备15018463号-20