Author Affiliations
1School of Criminal Investigation, People’s Public Security University of China, Beijing 100038, China2Center for Research on Intelligent Perception and Computing, Institute of Automation, Chinese Academy of Sciences, Beijing 100190, Chinashow less
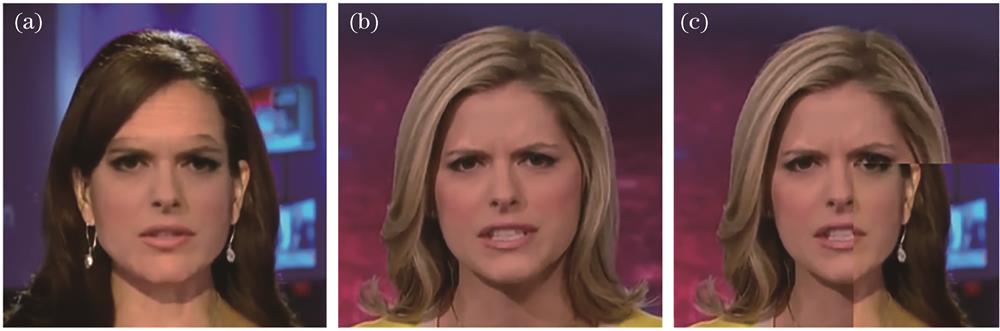
Fig. 1. CutMix augmented image example. (a)(b) Original samples; (c) augmented sample
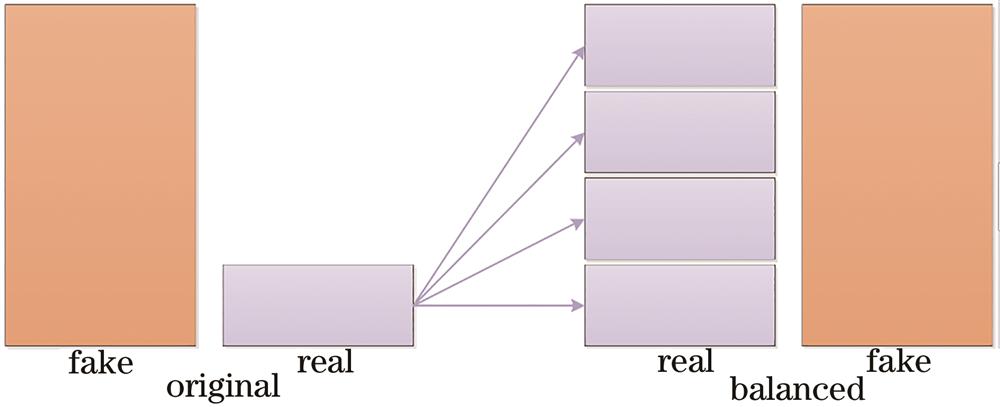
Fig. 2. Sampler for unbalanced data sets
Fig. 3. Proposed network structure
Fig. 4. ROC curves and AUC values of different models on the validation set
Fig. 5. Influence of hyper-parameter α and probability p on the detection model. (a) CutMix; (b) Mixup
Fig. 6. Results of data enhancement
| Input size | Operator | Number of channels |
|---|
| 299×299×3 | Entry flow | Conv1,2×2 | 32 | | 149×149×32 | Conv2,3×3 | 64 | | 147×147×64 | Block1 | 128 | | 74×74×128 | Block2 | 256 | | 37×37×256 | Block3 | 728 | | 19×19×728 | Middle flow | Block4,3×3 | 728 | | 19×19×728 | Block5,3×3 | 728 | | 19×19×728 | Block6,3×3 | 728 | | 19×19×728 | Block7,3×3 | 728 | | 19×19×728 | Block8,3×3 | 728 | | 19×19×728 | Block9,3×3 | 728 | | 19×19×728 | Block10,3×3 | 728 | | 19×19×728 | Block11,3×3 | 728 | | 19×19×728 | Exit flow | Block12 | 1024 | | 10×10×1024 | SeparableConv2d,3×3 | 1536 | | 10×10×1536 | SeparableConv2d,3×3 | 2048 | | 10×10×2048 | Pool,1×1 | |
|
Table 1. XceptionNet structure
| Dataset | Number of fake images | Number of real images |
|---|
| Train dataset | 28800 | 7200 | | Test dataset | 5600 | 1400 | | Validation dataset | 5600 | 1400 |
|
Table 2. Description of dataset
| Description | Logloss | Accuracy | Parameters /106 |
|---|
| Block6 | 0.5539 | 0.8554 | 5.95 | | Block7 | 0.5386 | 0.8631 | 7.56 | | Block8 | 0.5258 | 0.8721 | 9.18 | | Block9 | 0.5185 | 0.8684 | 10.79 | | Block10 | 0.5398 | 0.8687 | 12.41 | | XceptionNet | 0.5497 | 0.8757 | 20.81 |
|
Table 3. Model optimization experiment
| Method | Model | Logloss | Accuracy | Parameters /106 |
|---|
| Method in Ref.[18] | EfficientNet_b3 | 0.5840 | 0.8803 | 12.23 | | Method in Ref.[28] | ResNet50 | 0.5413 | 0.8684 | 25.56 | | Method in Ref.[10] | SPPNet | 0.8092 | 0.8660 | 25.64 | | Method in Ref.[20] | XceptionNet | 0.5497 | 0.8757 | 20.81 | | Proposed method | Xcep_Block8 | 0.5258 | 0.8721 | 9.18 |
|
Table 4. Comparison between the proposed model and other classical algorithms
| Description | Logloss | Accuracy |
|---|
| Xcep_Block8 | 0.5258 | 0.8721 | | Xcep_Block8+Over sampling | 0.4329 | 0.8751 | | XceptionNet | 0.5497 | 0.8757 | | XceptionNet+Over sampling | 0.4725 | 0.8779 |
|
Table 5. Improvements for the imbalance of sample categories
| Description | CutMix | Mixup |
|---|
| Logloss | Accuracy | Logloss | Accuracy |
|---|
| =0.5,p=0.7 | 0.3271 | 0.8760 | 0.3196 | 0.8780 | | =0.5,p=0.8 | 0.3270 | 0.8759 | 0.3080 | 0.8724 | | =0.5,p=0.9 | 0.3334 | 0.8734 | 0.3117 | 0.8737 | | =0.5,p=1 | 0.3097 | 0.8819 | 0.3170 | 0.8731 | | =1,p=0.7 | 0.3210 | 0.8743 | 0.3151 | 0.8683 | | =1,p=0.8 | 0.3376 | 0.8767 | 0.3162 | 0.8704 | | =1,p=0.9 | 0.3122 | 0.8822 | 0.3147 | 0.8686 | | =1,p=1 | 0.3185 | 0.8773 | 0.3211 | 0.8667 |
|
Table 6. Influence of different parameter settings on hybrid data enhancement results
| Description | Logloss | Accuracy |
|---|
| Baseline(Xcep_Block8) | 0.4329 | 0.8751 | | +Cutout(size is 50) | 0.5143 | 0.8760 | | +Cutout(size is 80) | 0.5228 | 0.8750 | | +Cutout(size is 110) | 0.4674 | 0.8744 | | +Mixup | 0.3196 | 0.8780 | | +CutMix | 0.3122 | 0.8822 |
|
Table 7. Experimental results of data augmentation